Machine Learning Foundations A Case Study Approach Week 5
Recommending Products
This module is going to talk about recommender systems. One prototypical example of where recommender systems are really useful is in recommending products.
- Imagine having a large set of products and there are some users
- Want to recommend a subset of the products to those users
- Well the question is, how to do this
Going to talk about how to use machine learning techniques in order to use the past history of purchases, as well as the purchases of other people, to determine which products to recommend.
The recommender systems just have a really, really wide range of applications, and they’ve exploded in popularity over the last decade.
- Amazon was an early pioneer in this area, focused on product recommendation
- Another example that really popularized recommender systems was a competition that Netflix ran starting back in 2006 ending in 2009, for the best recommender system for movies
Where To See Recommender Systems
Start by discussing some areas in which recommender systems are playing a really active role behind the scenes. Depending on the specific application, different aspects of the objective trying to optimize are going to be important.
Personalization Transforming Experience For The World
Before start talking about recommender systems, it’s really important to talk about the idea of personalization, because personalization is transforming the experience of the world. Talked about in the clustering and similarity, there are lots and lots of articles out there, and lots and lots of webpages. Cannot possibly be expected to browse all of them.
YouTube: 100 Hours a Minute, What to care about?
- It is quoted that there are roughly 100 hours of video recorded per minute
- The question is what to care about
- Go on YouTube, and watch some video that is of interest
- So this is an example, clearly, of information overload
Information overload → Browsing is “history” - Need new ways to discover content
- There is way too much content to be able to go and find what is of interest without somebody helping that content
- So browsing, the traditional form of browsing, is history
- There needs to be some way in which the content that’s relevant is automatically discovered
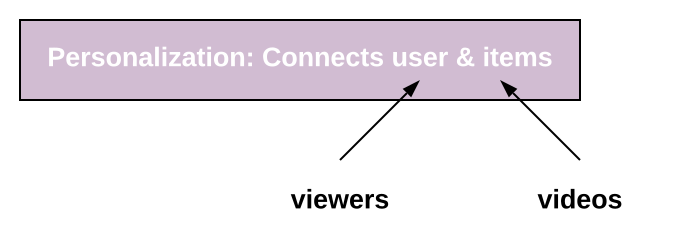
- So this the notion of personalization, where connecting user, who goes to YouTube, and item which are going to be videos on YouTube
Movie Recommendations
Personalization is going to play a key role in this notion of recommender systems. Talk about some examples where recommender systems are very important.
- One very classic example mentioned earlier was the idea of Netflix
- People go and watch videos
- Netflix has this goal of trying to make suggestions of which movies or TV shows might be of interest
- Question is, how to go about doing these recommendations
Connect users with movies they may want to watch
Product Recommendations
Another example, again going back to something earlier, is Amazon making product recommendations.
- Go to Amazon, purchase some product, and the site it makes recommendations of other products of interest
- But one important thing to incorporate in these recommendations is the fact that not only take into account the interest that the person had in this one session
- Somebody bought a book about websites might be interested in another book about web applications
- There are lots of other reasons why go to Amazon and make purchases
- Look at the history of purchases will be able to make much better recommendations than just based on a single session
Recommendations combine global & session interests
Likewise, recommendations might change over time.
- So there is interest in making recommendations for what might be interested in purchasing today
- Look at purchase history a year ago, but that’s probably not something very likely to purchase today
- So the recommendations that Amazon presents today have to adapt with time
Music Recommendations
Just as on demand video with personalized recommendation has really revolutionized how people watch movies and TV shows, likewise there are a lot of websites that provide stream audio with personal recommendations.
- However, in this case unlike thinking about on demand video, want one song to play after another
- Want some coherent stream of songs, similar songs
- Do not want rapidly switch between, for example, playing some cafe indie song, all of a sudden to playing a heavy metal song
- But at the same time, don’t want a song heard before to play again and again
- Want some sense of recommendations that are coherent, but also want them to provide a diverse sequence of songs to listen to
Recommendations form coherent & diverse sequence
Friend Recommendations
Another critical area where recommender systems have played a very active role is in social networking.
- So for example on Facebook there are tons and tons of users
- Want to form connections between these users
- Facebook wants to recommend other people might be interested in connecting with
In this application it is important to note that both the users and items are of the same type (both people). So when a user on Facebook, the things that are being recommended, the items, they are other people. It is going to end up with users and items being exactly the same type in this application.
Users and items are of the same type
Drug-Target Interactions
But the recommendation system talked about have really focused on online media. But more and more, people are realizing other areas in which recommender systems can play a really important role.
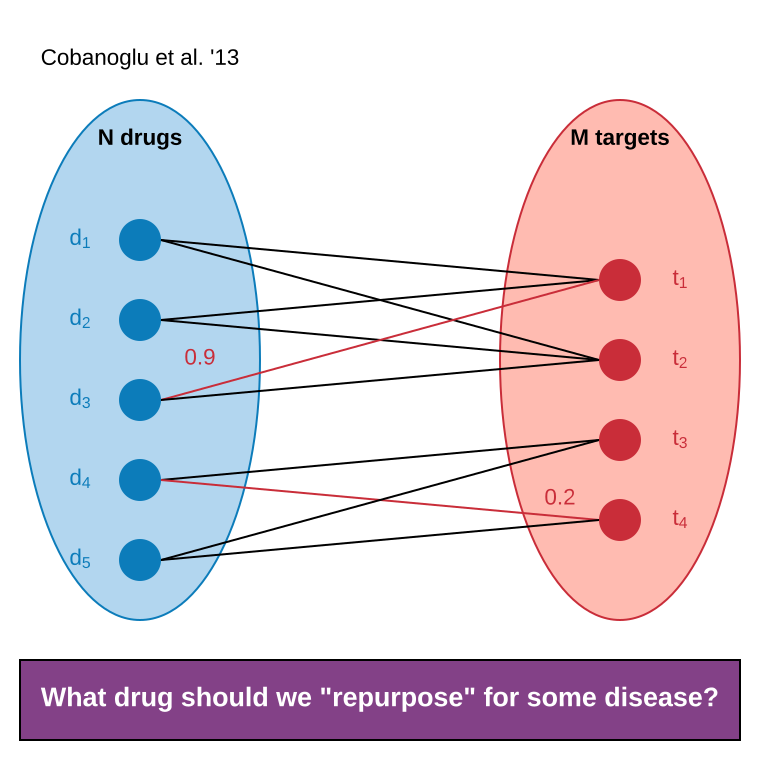
- Just as one example, think about what is call drug-target interactions
- Have some drug that’s been studied (aspirin)
- It’s been well studied as a treatment for headaches
- But what if it’s discovered to have some other possible use (blood thinning? heart patients?)
- If can find these types of relationships, if can repurpose this drug for some other treatment, then that could be really useful
- It’s really quite costly and lengthy process to get FDA approval for a completely new drug
- But if can take a drug where the types of side effects and the possible risk associated are already well known and well studied
- Then it’s a lot easier to get approval for treatment with some other condition
So this is a case where Aspirin used for headache, Aspirin can also be used for heart condition. So recommender systems are playing an active role in medicine as just an example of the diversity of application for these type of systems.
What drug should we repurpose for some disease?
Building a Recommender System
Talked about a lot of application domains for recommender systems, but now talk about how to actually build a recommender system.
Solution 0: Popularity
There are lots and lots of approaches for performing these types of recommendations.
The first Level 0 way might think about recommending products is just based off of the popularity of each product.
Simplest Approach: Popularity
- What are people viewing now?
- Rank by global popularity
This approach is actually really popular on things like news sites.
- So for example, New York Times has a list that says, MOST POPULAR articles, and it’s sorted by different topics (most E-MAILED articles)
- So here when think about recommending articles to other readers, just sorting the articles by how often they were shared by other readers on New York Times
So this can work fairly well. Might actually discover an article that is of interest in using this type of approach. But one disappointing thing about it is it completely lacks personalization.
- All the recommendations are based off of the entire population of New York Times readers out there, which is actually pretty diverse
- So instead, would of course like to have a method that knew a little bit more of interests to recommend news articles
Solution 1: Classification Model
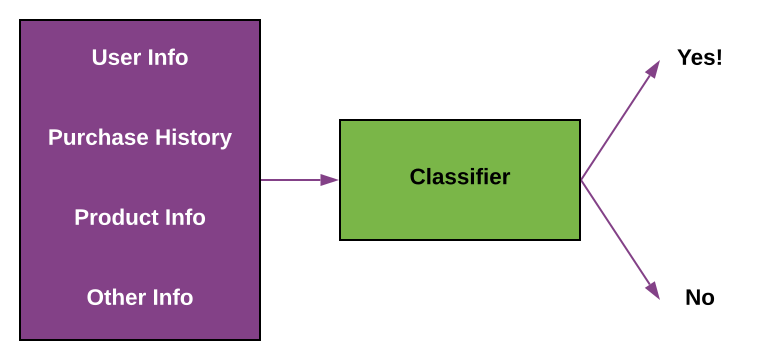
So try and add in a little bit of personalization using a classification model where it is going to use features of both the products and the users to make recommendation.
- This classification model is going to look exactly like the classification model from before
- Where there, using classification to do sentiment analysis
- But here, going to use this model to classify whether a person likes or does not like a product
What’s The Probability Buy This Product?
- Pros:
- Personalized: Considers user info & purchase history
- Features can capture content: Time of the day, what I just saw, …
- Even handle limited user history: Age of user, …
So this classification model is going to take in:
- Features about the user
- Features about the past purchase of that user
- Features about the product about possibly recommending
- As well as potentially lots of other features
Going to shove all these features into the classification model, and it’s either going to spit out:
- Yes, this person is going to like this product
- No, they’re not going to like it
This type of classification approach has a lot of things going for it.
- So first it can be very personalized
- Using features of the user as well as the user’s purchase history
- In addition, this model can capture context
- So for example, can take into consideration the time of the day, what that person just saw
- Maybe much more likely to purchase a textbook during the day or home products at night
- One other really nice thing about this approach is the fact that it can handle a very limited user history
- So for example, a user on Amazon and haven’t purchased many items in the past
- So for a lot of approaches, there might be a lot of ambiguity about what might be interested in or not
- But if it has information such as age, that alone can be very predictive of what might like or not like
Limitations For Classification Approach
- Features may not be available
- Often doesn’t perform as well as collaborative filtering methods (coming up next)
But this approach has limitations as well.
- One of the important limitations is the fact that these features talked about, that can be so informative about the products to potentially like or not, might not be available
- So for example, might not know age, gender, and the list goes on
- Likewise, for a product there might also be either missing information or very poorly written product description
- Especially on Amazon where there are lots of people selling different products
- The quality of that information might be pretty low
So often what actually see is something that’s called collaborative filtering, can actually work better than this type of classification approach.
Solution 2: People Who Bought This Also Bought…
So this notion of collaborative filtering is that somehow want to leverage what other people have purchased. The case of product recommendation or other links more generically between users and items, to make recommendations for other users.
So it seems very intuitive that when thinking about doing product recommendation, want to build in information like:
- If a person bought this item, then they’re probably also interested in some other item, because lots and lots of examples in the past of people buying those pairs of items together
- Maybe not simultaneously at the same time, but in the course of their purchase histories
Co-Occurrence Matrix
- People who bought diapers also bought baby wipes
- Matrix C: store # users who bought both items i & j
- () matrix
- Symmetric: # purchasing i & j same as # for j & i ()
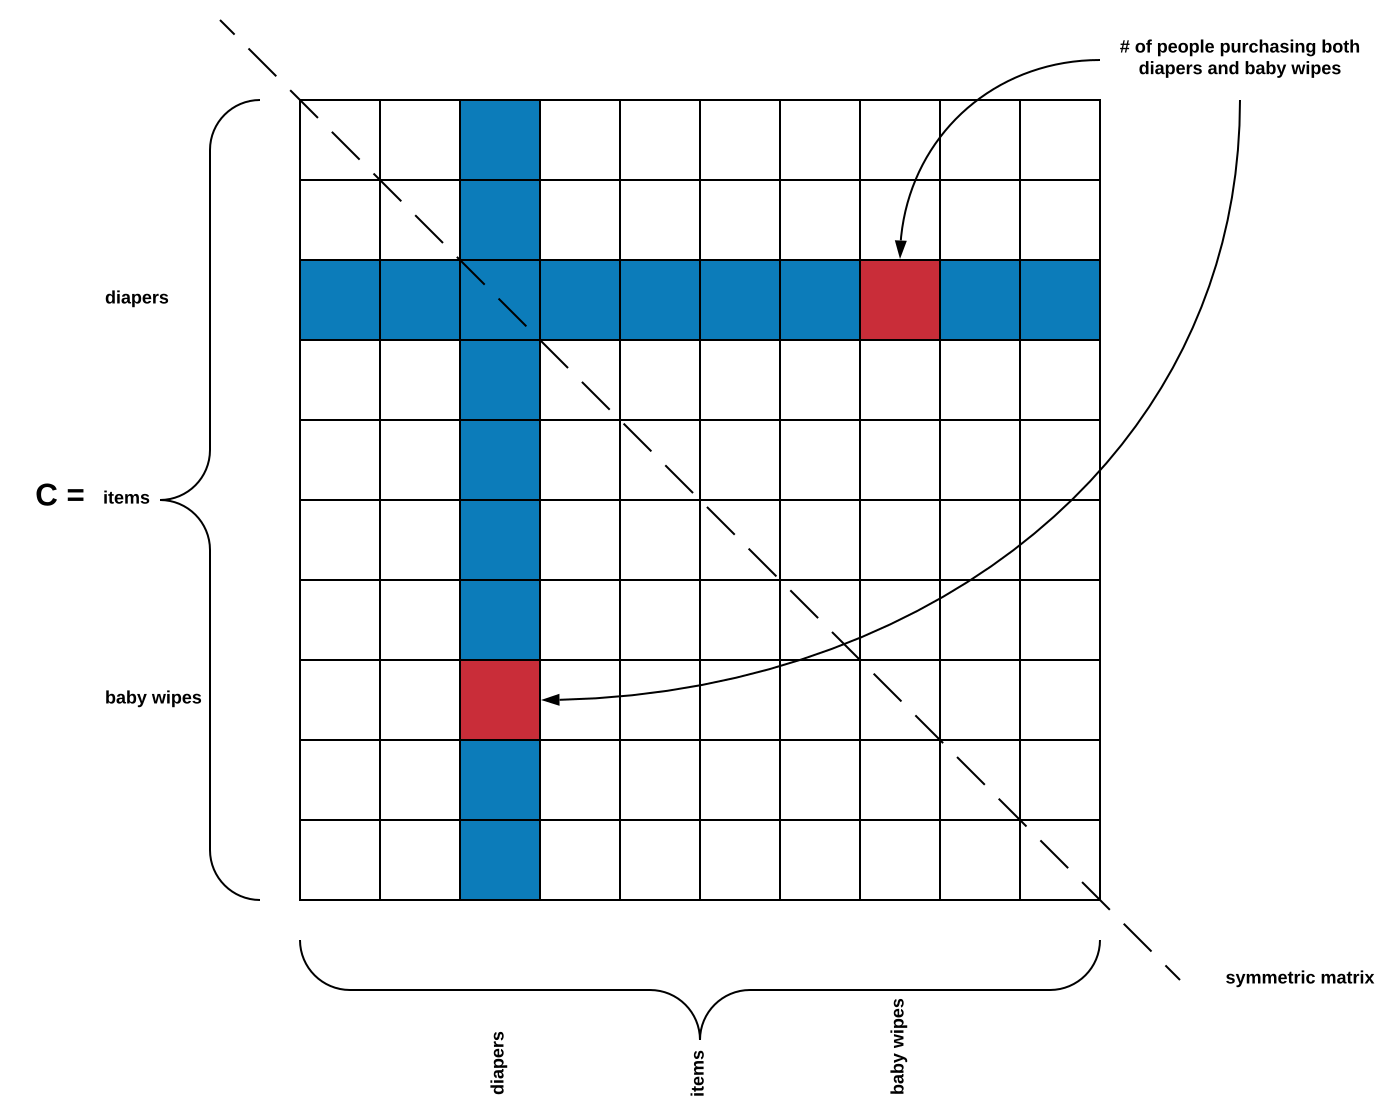
So this bring it to the idea of co-occurrence of purchase. So for example, if someone was just on Amazon buying diapers, well there is probably lots of examples of people who bought diapers also bought baby wipes. So how to use this type of co-occurrence of purchases to make recommendations?
Talk about this co-occurrence matrix that is going to be build up. This is going to store all of the information about which purchases people bought together. Again, when it say together, it doesn’t mean simultaneously, just together at some point in the history of purchases.
So going to build this Matrix C, and this matrix is an matrix.
- Going to list all the different items for the rows of this matrix
- Likewise, all the different items for the columns
- So for example, maybe a row of this matrix might be the row corresponding to diapers (3rd row)
- Then would also have that a column of this matrix corresponds to diapers as well (3rd column)
- So if want to say that many people purchased diapers and baby wipes, look at the row for diapers and then scroll over to the column for baby wipes
- In this entry of this matrix there’s some number entered, and that number represents the # of people purchasing both diapers and baby wipes
Well a question. Is the number of people who purchased diapers and baby wipes, the same as the number of people who purchased baby wipes and diapers?
- Yes, so would go to the baby wipes row, and the diapers column, and notice that this is the exactly same number
- So what this means is this is a symmetric matrix
- If look across the diagonal, then going to see a reflection
- If took this matrix and folded it across the diagonal line, would get exactly the same numbers matching up
Just to reiterate the way of building up this co-occurrence matrix.
- Going to search through all the user’s history of purchases they’ve made
- Count every time a purchase of diapers along with all the other items, going to add one (1) to that entry
- Keep incrementing the matrix as searching over users
Making Recommendations Using Co-Occurrences
- User purchased diapers
- Look at diapers row of matrix
- Recommend other items with largest counts
- baby wipes, milk, baby food, …
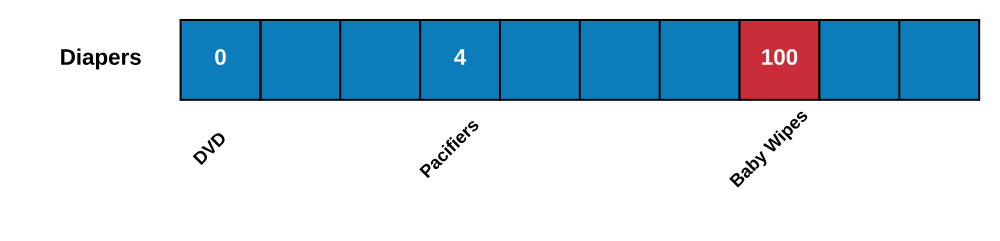
But now talk about how going to use this co-occurrence matrix in order to make recommendations. It’s really, really straightforward.
- So say that a user has just purchased diapers, and want to make some recommendation for them
- Going to look at the diapers row of this matrix (if go back to Matrix C, going to grab out the diapers row)
- What this row has is how often people bought diapers
- 100 baby wipes
- 4 pacifiers
- 0 DVD
- Going to have this whole vector of counts of how many times people who bought diapers, bought all these other products
Using this, now can very straightforwardly make the recommendations. All that is needed is to sort this vector and recommend the items with the largest counts. So maybe recommend baby wipes, milk, baby food, and things like this for somebody who just purchased diapers.
Co-Occurrence Matrix Must Be Normalized
- What if there are very popular items?
- Popular baby items: Pampers Swaddlers Diapers
- For any baby item (e.g., ) large count for
- Result
- Drowns out other effects
- Recommended based on popularity
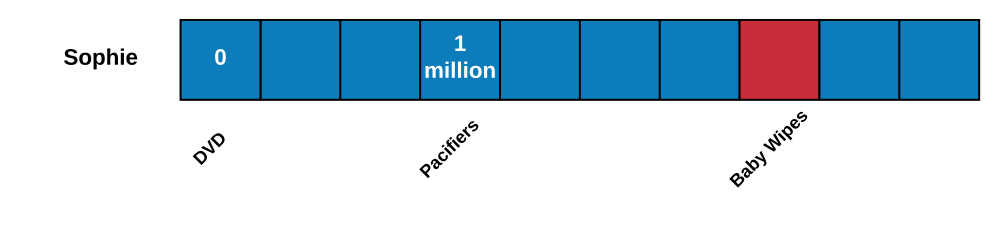
One issue though with these co-occurrence matrices is that the fact they have to be normalized, because what happens if there is a very popular item?
- So one of the most popular items for babies is diapers.
- There are lots of these around
- They are very, very useful for baby
- So basically, if going to purchase any baby item on Amazon, also very likely at some point to have purchased diapers.
But look at some other item.
- For Sophie The Giraffe
- It’s actually one of the most gifted items on Amazon for babies
- But it’s a little teether
- Little babies like to bite on this
- It’s rubbery
- It squeaks
- Keeps them very interested
But think about what happens when looking at this other item.
- So just purchased Sophie The Giraffe, and want to make recommendations for the person who just purchased this little toy
- So going to look at the counts vector for Sophie The Giraffe.
- Again have DVD that nobody’s purchasing
- Then have diapers (some enormous number, 1 million)
- Then have baby wipes
- All the other products
- So what ends up happening is that regardless of what product looking at
- Regardless of whether just purchased Sophie The Giraffe
- Or just purchased this little stacking toy
- Or just purchased this really cute alligator that makes this sound and it rattles
- No matter what purchased, according to the process that just described, it is really, really likely to recommend diapers
So think about how to make the recommendations a little bit more personalized, and have the effect that everybody buying diapers doesn’t mean that they are particular interested.
So this is just to reiterate, which is the fact that having these very large counts for popular items, drowns out all the other effects. So just going back to this default thing of recommending based off of popularity, which is what is trying to address with these different types of recommender systems.
Normalize Co-Occurrences: Similarity Matrix
- Jaccard similarity: normalizes by popularity
- Who purchased divided by who purchased
- Many other similarity metrics possible, e.g., cosine similarity
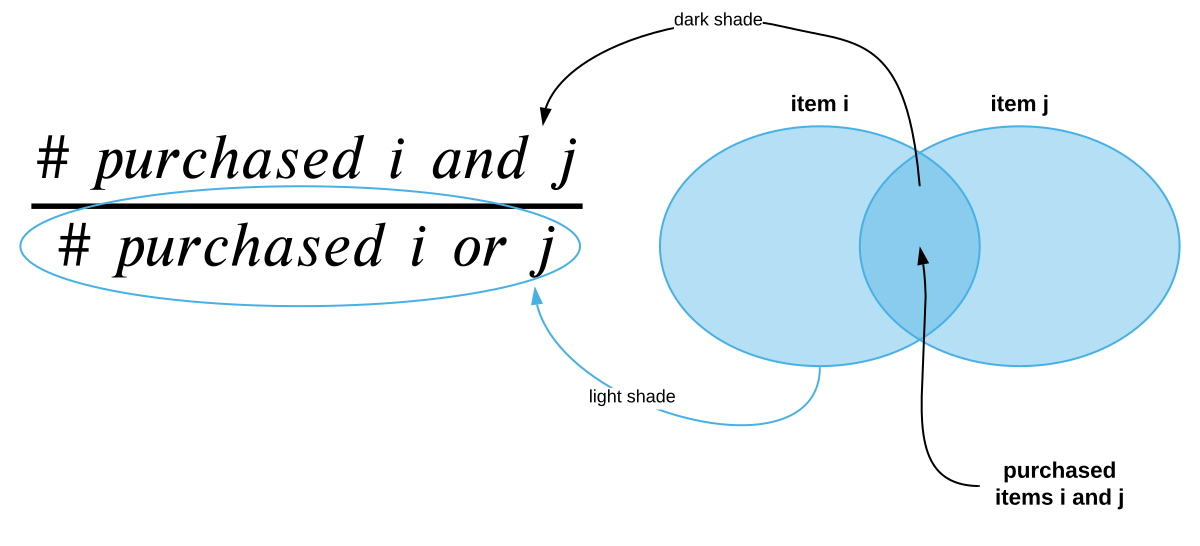
So to handle this situation of having very popular items, can think about normalizing the co-occurrence matrix. One way in which can normalize this matrix is with something call Jaccard Similarity.
Want to mention that this notion of normalizing this co-occurrence matrix, is very similar to the clustering and similarity module, when talking about tf-idf.
- Where there looking at documents and said that really, really common words just swamped out other words that might have cared about.
- So it had this way of using tf-idf to renormalize the raw word counts that is used to represent the document.
Well in this case, this is a very similar notion of accounting for very popular item. The way it works is pretty intuitive.
- Just going to count the number of people who purchase some item and some item
- So number who purchased and
- What the matrix had before
- So those are the new raw counts
- Going to normalize by the number of people who purchased either of these items
- So the number who purchased or
- So a simple venn diagram explains this very clearly.
- The world of people that purchased item (left)
- The world of people that purchased item (right)
- The people who purchased and (shaded area)
So going to take the count from before, this is the numerator, the shaded area (purchased and ), and normalizing by the total area. Circling the whole entire world of unique users that purchased items or , so that’s the denominator.
So that’s one way in which can normalize the co-occurrence matrix, and there are other things can think about like cosine similarity. Will talk about these other metrics more later.
Limitations
- Only current page matters, no history
- Recommend similar items to the one you bought
- What if you purchased many items?
- Want recommendations based on purchase history
But this method has its own limitations.
- Here, one issue is the fact that only the current page matter
- So it only matter that Sophie the giraffe was bought when looking for making recommendations
- Not looking at the entire history of things that is purchased to inform these recommendations
- Talk about a way in which can modify the approach to account fo history of purchases
(Weighted) Average For Purchased Items
- User bought items
- Compute user-specific score for each item in inventory by combining similarities:
- Could also weight recent purchase more
- Sort and find item with highest similarity
So a really simple approach is just to do a weighted average over the scores that would have placed on the products, for each item in the purchase history. So go though a concrete example of this.
- Imagine that the only items ever purchased on Amazon were diapers and milk
- So now want to make recommendations for the user that only make purchases for diapers and milk
- Going to go through every item might think about recommending, and going to compute the Score as follows
- So looking at whether want to recommend the item baby wipe
- In this case, going to compute a weighted average, over how much would’ve recommended baby wipes just based on having purchased diapers before
- So that’s using the exact technique just talked about
- So looking at the row diapers, and looking at how many times people also bought baby wipes
- But then also going to look at the row for milk, and look at how many times people who bought milk bought baby wipes
- Going to average these two result to say how much, or how likely it is to purchase baby wipes, given this purchase history
Could do other variance instead of it just the simple weighted average. Could weight more heavily on recent purchase history to account for context, and so on.
So then when want to make the recommendation, just sort this weighted average score and recommend the product(s) that have the most weight. So similar to the purchase history talked about before, but now combining weights based on purchase history.
Limitation
- Does not utilize:
- context (e.g., time of day)
- user features (e.g., age)
- product features (e.g., baby vs. electronics)
- Cold start problem
- What if a new user or product arrives?
But this method still has some limitations.
- So for example
- It doesn’t use context, like time of day, at least not directly
- It doesn’t use features of the user like age, or gender, or anything like that
- It’s grouping all users together when it’s thinking about looking at this co-occurrence matrix
- Likewise, it doesn’t use feature of the products
- So everything’s just pooled together without any kind of notion, of different properties of these products, or users to drive these recommendations
- Another big problem here is something called the cold start problem
- This is a really important problem that is faced in a lot of different domains
- But talk about it in this context
- The cold start problem is the fact that, a new user or a new product
- How to form recommendations
- Have no observations ever for that product, so have no notion of how often it’s been purchased along with something else because it’s never been purchased
- Likewise for a user, no information about past purchase
Solution 3: Discovering Hidden Structure By Matrix Factorization
So in the co-occurrence approaches talking about so far, there’s been no notion of different aspects of the user(s) or feature(s) of the product that are driving the recommendations made. Instead, simply counting co-occurrences of purchases and user histories.
So a natural question is, whether can somehow use some aspect of the user and what a product is to drive the recommendations just like talked about in the classification approach.
- Have some set of features for the user and the product
- But here, like to be able to learn these features from the data
That will help to cope with the problems talked about where might not have features available.
Movie Recommendation
In addition, like to take into account interactions between users and items just like the co-occurrence application approach. Going to discuss this in the context of a movie recommendation task because it’s very intuitive to talk about this application for the methods going to describe.
- Users watch movies and rate them
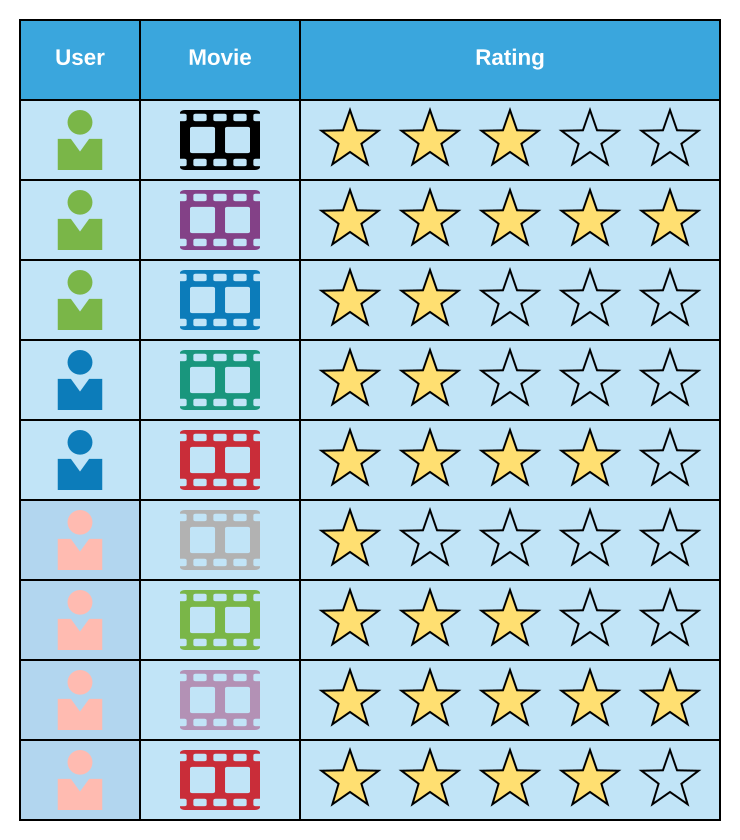
Each user only watches a few of the available movies.
In this application, have a very big table of user, movie, and rating combinations.
- The data is the big table where a whole bunch of users that are watching some set of movies, and they rate those movies
- Green user went on, watched three different movies, gave them a rating of three stars, five stars, and two stars
- Blue user, watched two different movies
- Pink user, watched four different movies
Matrix Completion Problem
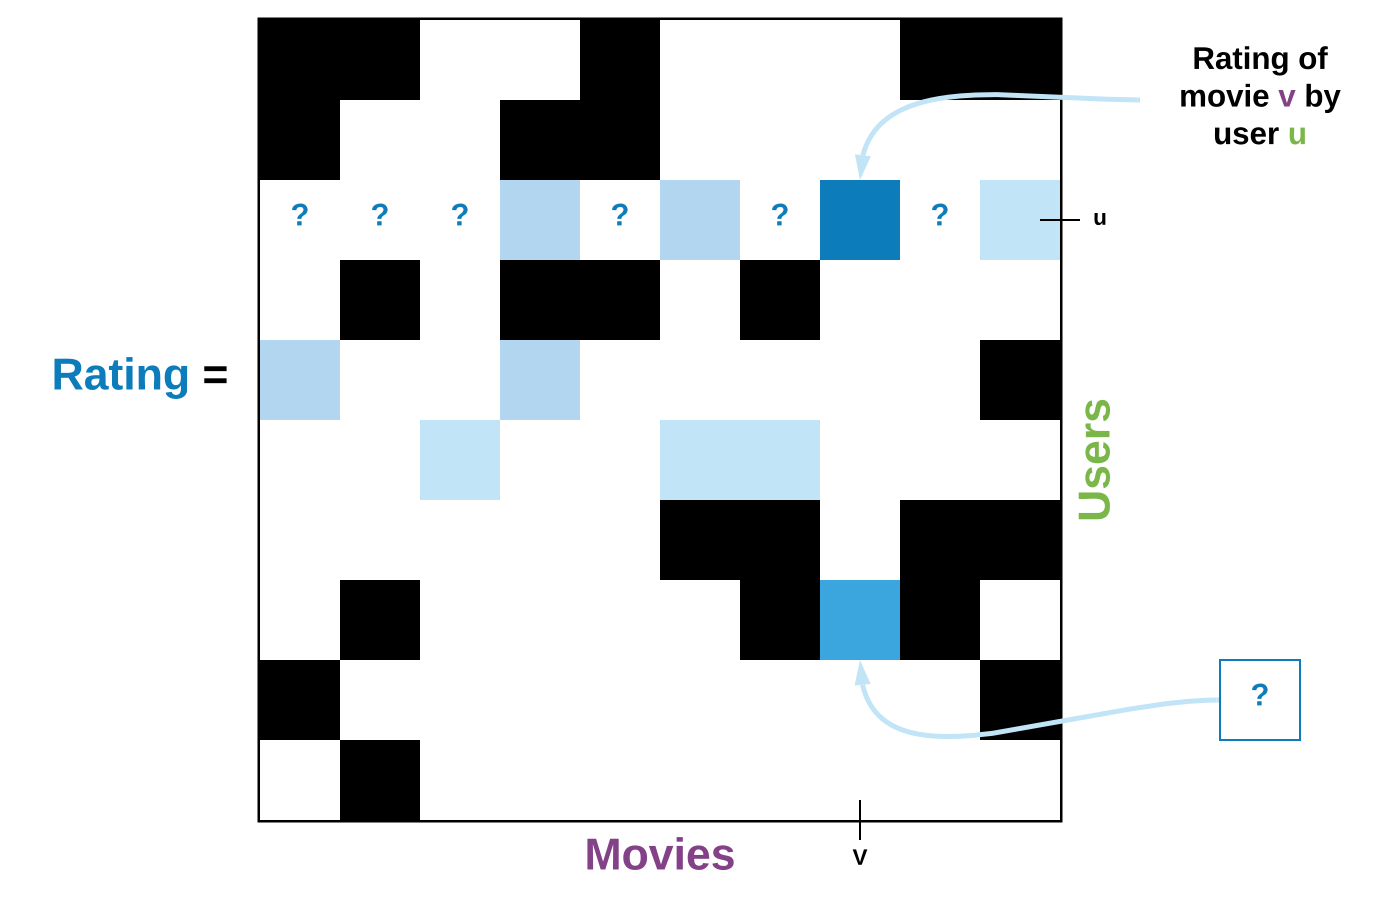
- Data: Users score some movies
- known for black cells
- unknown for white cells
- Goal: Filling missing data
Going to transform the data table into a really big users by movies matrix of ratings. The reason it’s a really big matrix in general is there tend to be a lot of users and a lot of movies.
But at the same time, this matrix is very sparse
- There are lots and lots of movies
- There are a lot of users
- There’s only a few movies that any given user has watched
Looking at this matrix, say for example
- A row represents
- A column represents
- A black square represents the rating that gave to
There are a few of these black squares, but there are lots and lots of these white squares.
- A white square represents a question mark
- It’s a case where a user has not watched a movie or at least has not provided a rating for that movie
- All white squares represent unknown rating (they don’t represent rating of zero)
- It’s not that the user did not like that movie
- It’s just it doesn’t know what the user thinks about that movie
Going to state that
- is the rating that gave to , and it’s known for the black squares
- is unknown for the white squares
The goal here is to fill in all the question marks, all these white squares. The way going to do this
- Going to take all the ratings that the user has provided (all the black suqare(s) for that user)
- Use these to predict what the rating is for these the question marks
- All of the question marks going to fill in using user’s history as well as those of all other users
So taking the history of ratings of that user and every other user, and using it to predict how much they’re going to like this movie that they haven’t watched (filling in a question mark).
Reiterate, that not just using the ratings of a user, but using all of the ratings (all black squares) when going to make that prediction. Just know that’s all the information used to fill in this really big sparse matrix.
Supposed Had Topics For Each User, Each Movie
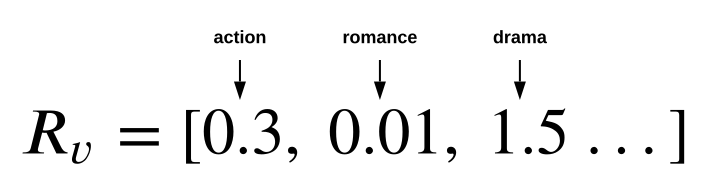
- Describe with topics
- How much is it action, romance, drama, …
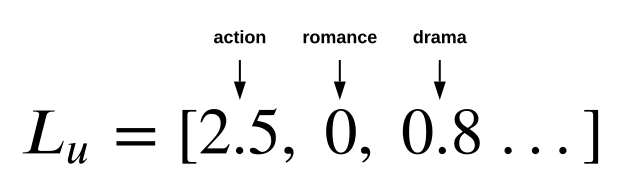
- Describe with topics
- How much she likes action, romance, drama, …
- is the product of the two vector
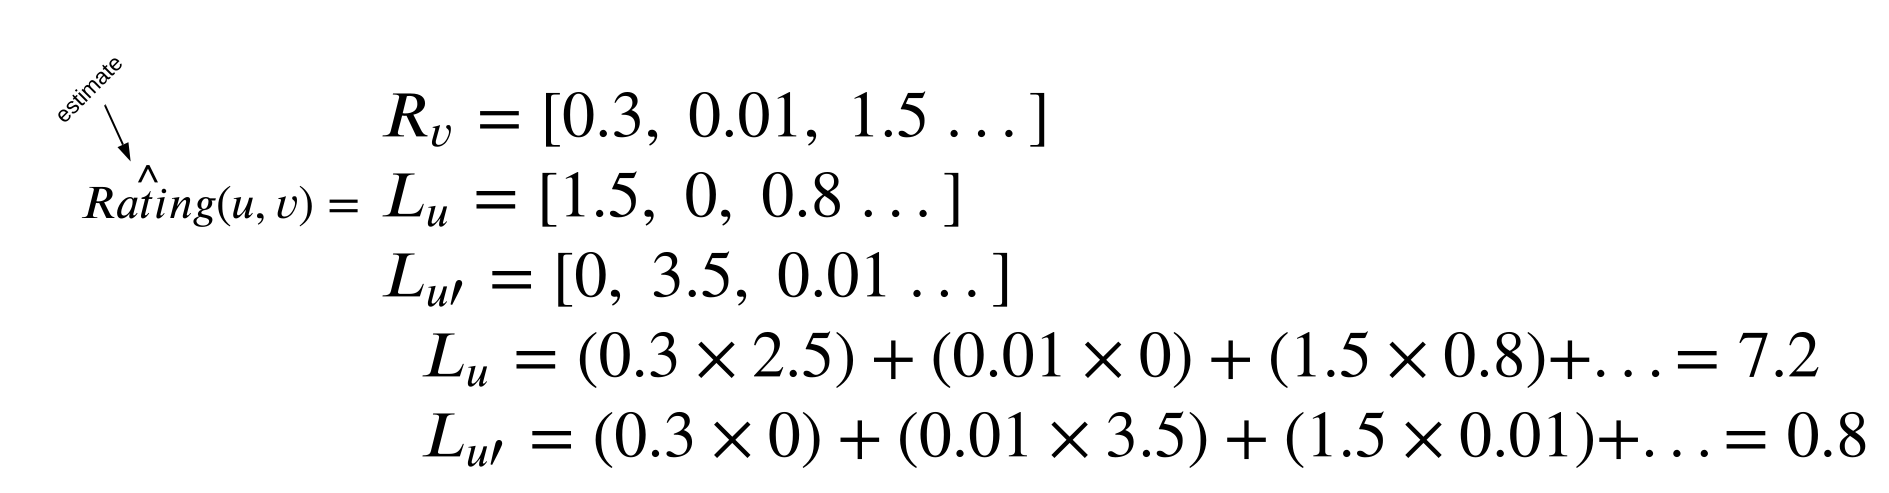
- Recommendations: sort movies user hasn’t watched by
A question is how to make these recommendations. How to guess what rating a person would give to a movie that they’ve never watched? Imagine for a moment, some set of features about each movie and each user So for example,
- Is about some set of different genres
- Action
- Romance
- Drama
- Have a vector for each of these things
- Have the set of things, so know what the movie is about
- Going to call this first vector the movie vector,
Likewise, for every , know which of these different genre the user likes
- So for this user, have a vector that says
- Action, really like
- Romance, really does not like
- Drama, kind of like
- Going to call this user specific vector,
Knowing this, then what to do to make a prediction of a rating?
- Well, one thing that might make sense is to take this movie vector and this user vector and see how much they agree
- If they agree a lot, then would guess that the user would rate that movie very highly
- If they don’t agree a lot, then would say that it’s probably very likely the user will not like the movie and give it a low rating
- So going to estimate the rating
- That’s why put this hat over it
- To denote this is an estimate of how much the , is going to like some that they’ve never seen before
So the way to do this is just like when measuring similarity between two documents
- Going to take the two vector
- In that case it might have been a vector of different topics for the document
- In this case talking about a vector of different topics about the movie, (, , , )
- Going to multiply it, element wise
- By user,
- Just say this ends up being some number like (just made that up)
- But if the user () vector really disagree with what the movie was
- Say their vector is
- Action, really don’t like
- Romance, really like
- Drama, really don’t like
- All these other number that really don’t agree with one another
- Maybe this would come out to be some small number like (made this up also)
- Say their vector is
So the point here is that when the movie vector and the user vector agree a lot, it will get a much larger number than when they don’t. So going to estimate a much larger rating then in the case where they disagree.
Then when thinking about making recommendations, what to do?
- Just sort over all movies predicted for the user, sort by their predicted rating
- Then recommend those with the largest rating
Highlight one thing here, the rating scale was between and
- Could provide no star if user really hated a movie
- But maximum score was a five ()
- But note here that one of the prediction is , which is clearly greater than
- So with this type of model, it is not restricted
- There’s nothing enforcing to stay within a score of to
- But can still use this to make recommendations because it just look at the movies with the largest score
- Even though those scores aren’t necessarily representative of exactly how many stars a movie would get
Prediction For Matrix Form
Going to take these ratings just talked about.
- Instead of talking about them for a specific combination of a movie and a user
- Talk how to think about representing the predictions over the entire set of users and movies
- To do this, going to need a little bit of linear algebra
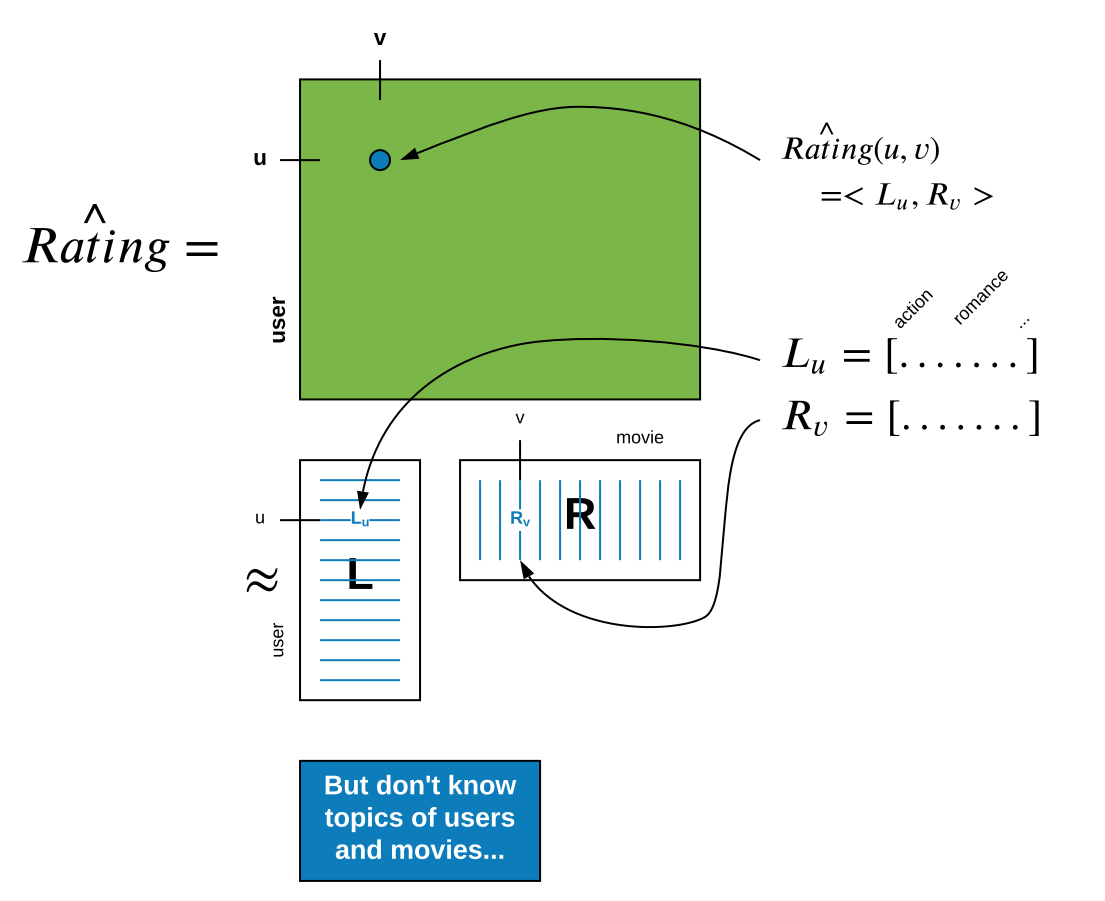
So in particular, looking at the score giving to a specific , for a .
- This is the rating predicted for and ()
- Took the user vector
- Took the movie vector
- Did this element-wise product
- Summed over the elements of that product
- Denote just with the notation of and
- What that represents is
- Taking a row of a big matrix
- So there’s a row that has a vector
- With how much that user likes different genre things like action, romance, and so on
- Then take a movie vector
- So is indexed over the same set of genres, or topics, for the movie
- Has some set of entries
- In this matrix notation
- Is the row, and the column
- If multiply these together, it get the entry of this resulting matrix
- Taking a row of a big matrix
This representation is a very compact way to take all of the vectors for all of the users and movies.
- Stacking up all of the user vectors
- Stacking up all of the movie vectors
Through this representation, end up with an entire matrix which is just like before. It’s a users by movies matrix. So all of the users that appeared (in matrix ), and all the movies that appeared (in matrix ), appeared as rows and columns in the matrix (Rating). Each individual entry is a combination of a specific row of matrix and a specific column of matrix .
Assumed…
- To know all these user topic vectors.
- So can stack them up into this matrix.
- To know all the movie topic vectors.
- So put the altogether in the matrix.
- Multiply the two together to get this big prediction of readings that every user would give to every movie.
But important thing here is the fact, don’t actually have this information. Do not have these features about the users, or about the movies.
Matrix Factorization Model: Discovering Topics From Data
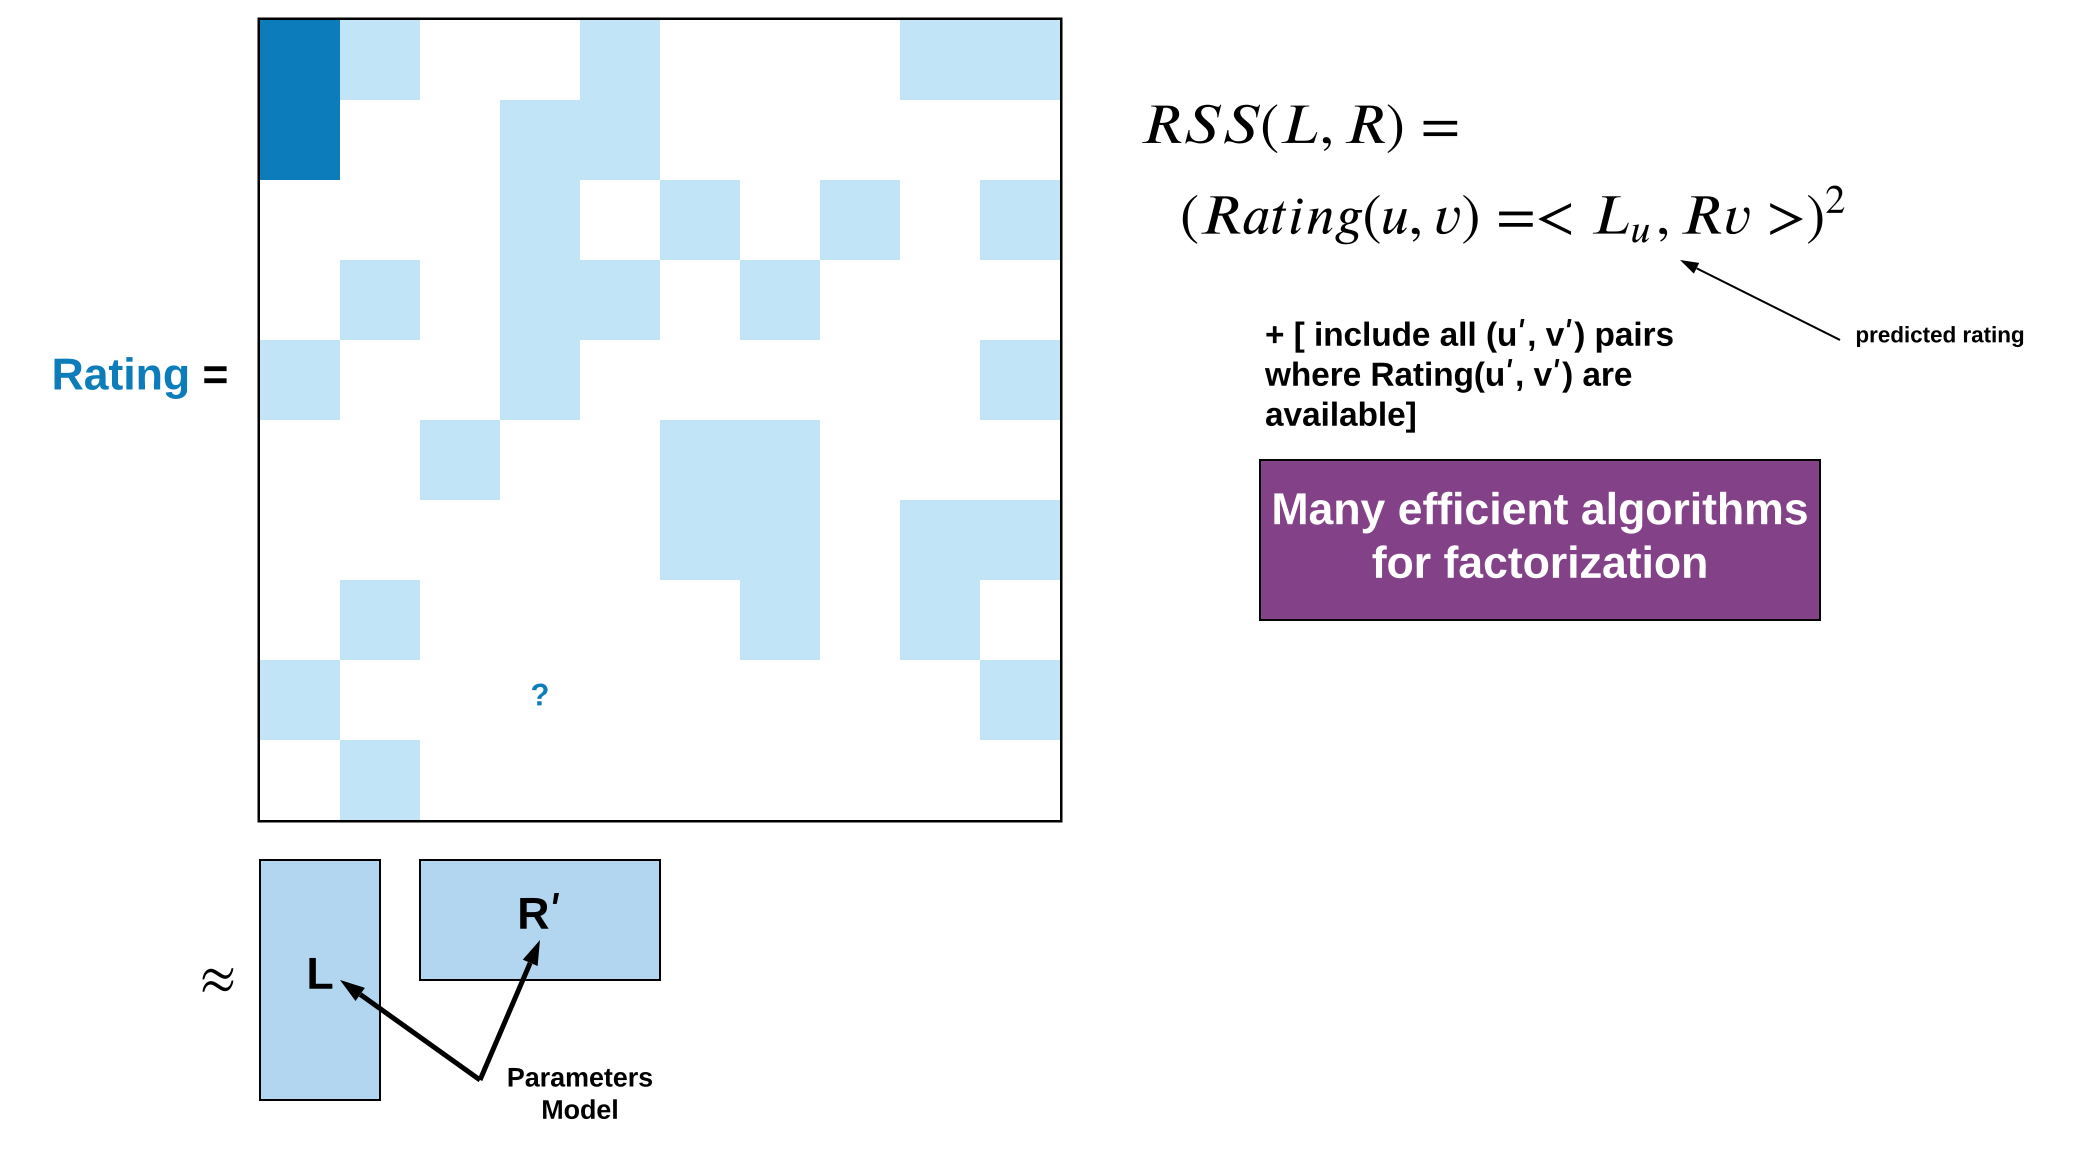
- Only use observed values to estimate “topic” vectors () and ()
- Use estimated () and () for recommendations
So instead, flip this problem on its head.
- Going to ry and estimate these matrices, and matrix
- Which is equivalent to estimating these topic vectors, or feature vectors
- For every user and every movie based on the observed ratings
- So these matrices, or these collections of topic vectors, are the parameters of the model
Going back to the regression, talked about models and their associated parameters in thinking about estimating those parameters from data. So this is a very similar notion.
- Data: observed ratings, so those are the black squares
- Parameter: user and movie topic factors
Going to estimate each of these from the observe rating. So only using the black cells, going to try and estimate these and , along with resulting matrices.
So how to do this?
- Well, think of a metric for fit just like in regression
- Going back, talked about something called residual sum of squares
- There talked about houses
- It had some set of features
- Then had weights on those features
- Those weights were the parameters
- Were predicting some house sales price
- Then compared with the actual sales price
- Looked at the square of the difference
- Summed over every house in the data set
- Well in this case
- The parameters of the model are and
- The prediction, the predicted rating (rating hat), is going to be
- This notation of doing this element wise product in summing
- That’s the predicted rating
- The observed rating is
- Look at the difference between observed rating and predicted rating with the parameters and
- Square them
- The residual sum of squares of the parameters and is equal to
- Then sum over all movies that have ratings
- Include all pairs
- Where and are available
- Where are these available? They are the black squares.
So taking a given matrix and matrix, looking at the predictions. Looking at and evaluate how well it did on all these black squares. Looking at how well the and that is used to fit the observed ratings.
Then when going to estimate and
- Just like when want to estimate the weights on the regression coefficients in the housing value prediction problem
- Search over, in this case, all the user topic vectors and all the movie topic vectors
- Find the combination of this huge space of parameters that best fit the observed ratings
So the reason this is called a Matrix Factorization Model is because taking this matrix (black square grid), and approximating it with this factorization ( and ) here.
But the key thing is the output of this. Is a set of estimated parameters ( () and ()) here.
There are a lot of efficient algorithms for doing this factorization. Going to talk about them in great extent in the recommender systems, or matrix factorization later on.
So very efficient algorithms for computing these estimates of and . How to form prediction? How to fill in all these white squares, which was the goal to start with.
- Just use the estimated () and ()
- For the prediction just as described when assumed to know these vectors
Limitations For Matrix Factorization
- Cold-start problem
- This model still cannot handle a new user or movie
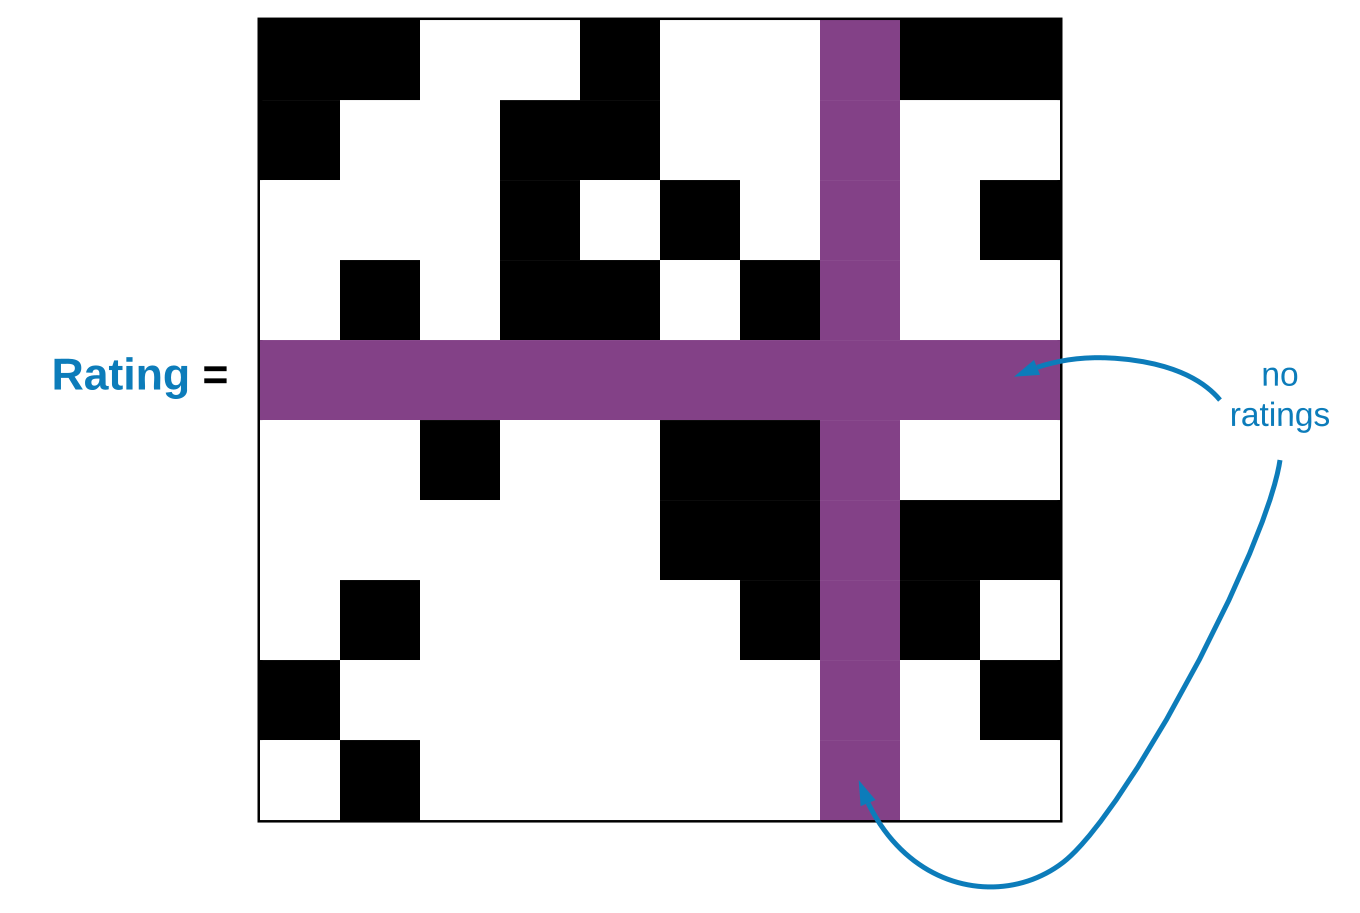
Matrix Factorization is a really, really powerful tool. It’s been proven useful on lots of different applications. But there’s one limitation, and that’s a problem talked about a little bit earlier of the cold-start problem where this model still can’t handle a new user or a new movie.
That’s the case where have no ratings either for a specific user or a specific movie. That might be a new movie that arrives or a new user arrives. This is a really important problem. One that, for example, Netflix faces all the time. How to make predictions for these users or movies?
Bringing It All Together: Featurized Matrix Factorization
Saw in the feature based classification approach that were able to handle cases where it might have very limited user data. On the other hand, in the matrix factorization approach, saw that it were able to capture relationships between users and items and in particular learn features of those users and those items. A question is, whether it can have some integrated approach to get the benefits of both worlds.
Combining Features, Discovered Topics
- Features capture context
- Time of day, what I just saw, user info, past purchases, …
- Discovered topics from matrix factorization capture groups of users who behave similarly
- Women from Seattle who teach and have a baby
- Combine to mitigate cold-start problem
- Ratings for a new user from features only
- As more information about user is discovered, matrix factorization topics become more relevant
So importantly the features of the classification based approach, or something like that can capture things like context.
- Time of day
- What I just saw
- User info
- Past purchases
Whereas the features that are discovered from matrix factorization can capture groups of users who behave similarly.
- Women from Seattle who teach and also a mom
So the question is how to combine these two different approaches. Well, it’s very straightforward.
Can take a new user for which it have not past purchase information, and can use just features specified by that user. Such as the person’s age, gender and so on, to predict the ratings that a person might have.
Likewise, as it get more and more data from that user, it can weight more heavily on the matrix factorization approach and use those learn features more strongly when it is forming the recommendations. So it’s very simple to think about combining the ideas of a user specified feature based model with the learned features from matrix factorization. Gradually switch between the two, depending on how much data’s available from each user or for each product.
Blending Models
- Squeezing last bit of accuracy by blending models
- Netflix Prize 2006-2009
- 100M ratings
- 17,770 movies
- 480,189 users
- Predict 3 million ratings to highest accuracy
- Winning team blended over 100 models
This idea of blending models is really popular. One example of where it’s really been shown to have impact in recommender systems was the classic example mentioned at the beginning of this module of the Netflix competition.
So this competition was a competition for who would provide the best predicted ratings for users on Netflix.
- The data set consisted of a hundred million different user ratings and movies
- There’s almost 18,000 different movies
- Nearly 500,000 unique users
- The goal was to predict 3,000,000 ratings to the highest accuracy
- The prize was a $1,000,000
- The leading team model actually blended over a hundred different models to get their performance
So this type of ensemble approach gonna discuss more in the classification module but this notion of combining models to get performance that exceeds the performance of any of the individual models is a very common and very powerful technique.
A Performance Metric For Recommender Systems
Talked at great length about how to form predictions using different types of recommender systems. But a question is, how to assess the difference in performance for these different systems might consider using?
The World With All Baby Products
Imagine want to recommend products to a new parent.
User Likes Subset Items
- There is a set of all possible products that might recommend
- A user likes a subset of these products
- The goal, of course, is to discover the products that the user likes from the purchases that they’ve made
- Don’t actually know which products they like
Why Not Use Classification Accuracy?
- Classification Accuracy = fraction of items correctly classified (liked vs. not liked)
- Here, not interested in what a person does not like
- Rather, how quickly can we discover the relatively few liked items?
- (Partially) an imbalanced class problem
So a question is, why not just use something like classification accuracy to measure the performance of a recommender system?
So in this case, could think about just counting how many items guessed that they liked versus they did not like and compare that to how many of those items they actually liked versus did not like. Talked about using this type of metric when talking about the sentiment analysis case study. But the issue here is actually multifold.
- One is the fact of caring more about what the person liked than what they didn’t like
- Faced with very imbalanced classes
- For example
- There are lots and lots of products out there
- But typically a user’s only going to like a very small subset of them
- So if to use this type of metric, can get very good accuracy by just saying that the user won’t like any of the items
- So not recommending anything will get pretty good performance according to this metric
- Another issue is something else which relates to the cost of making these different decisions
- Often assume that the user has a limited attention span
- Can only recommend a certain number of items for that user to look at
- There is a much large cost if out of this very small set of items, allowed to recommend to this person there’s no liked item
- That has a much higher cost than if missed some of the user’s liked items in this set of recommended product
So instead, going to talk about a different metric, or different metrics which are called precision and recall.
How Many Liked Items Were Recommended?
So for a given recommender system, it’s going to recommend some set of products…
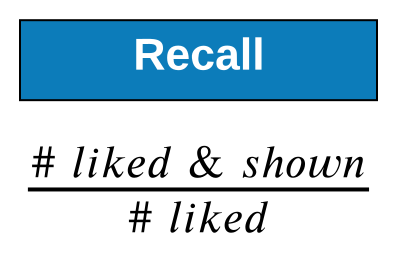
- When measuring recall, going to look at all the items liked
- Going to ask how many of the items that is liked were actually recommended
So recall is going to measure how much a recommended set of items cover the things interested in, things actually like. (Out of all the liked items, how many were liked and shown.)
How Many Recommended Items Were Liked?
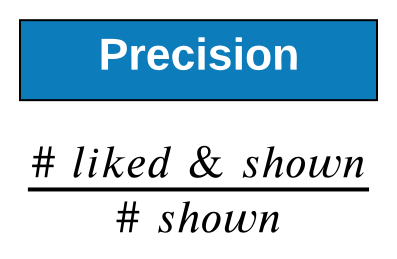
When talk about precision, going to look at all of the recommended items. (Out of all the shown items, how many were liked and shown.)
When thinking about precision, thinking about basically how much garbage have to look at compared to the number of items like. So, it’s a measure of when have a limited attention span, how much wasted efforts on products do not like?
Maximize Recall: Recommend Everything
So a question, how to maximize recall?
- Remember recall, look at the liked items, and measure how many of the liked items were actually retrieved or actually recommended
- There’s a very easy way to maximize recall
- Just recommend everything
- If recommend everything, it guaranteed to recommend the products liked
- So in this case, recall would just be
- Because all of the products liked were recommended
Resulting Precision?
But what’s the resulting precision of doing this?
- Well, it can actually be arbitrarily small
- Because
- If there are tons and tons of products out there
- If liked only a very, very small number of them
- If recommend everything
- Going to have very small precision
- Not a great strategy
Optimal Recommender
What would be the optimal recommender?
- Well, the best recommender is one that recommends all the products liked, but only the products liked
- So everything that was not liked was never shown by the recommender
What’s the precision and recall?
- Both are 1 in this case
Precision-Recall Curve
- Input: A specific recommender system
- Output: Algorithm-specific precision-recall curve
- To draw curve, vary threshold on # items recommended
- For each setting, calculate the precision and recall
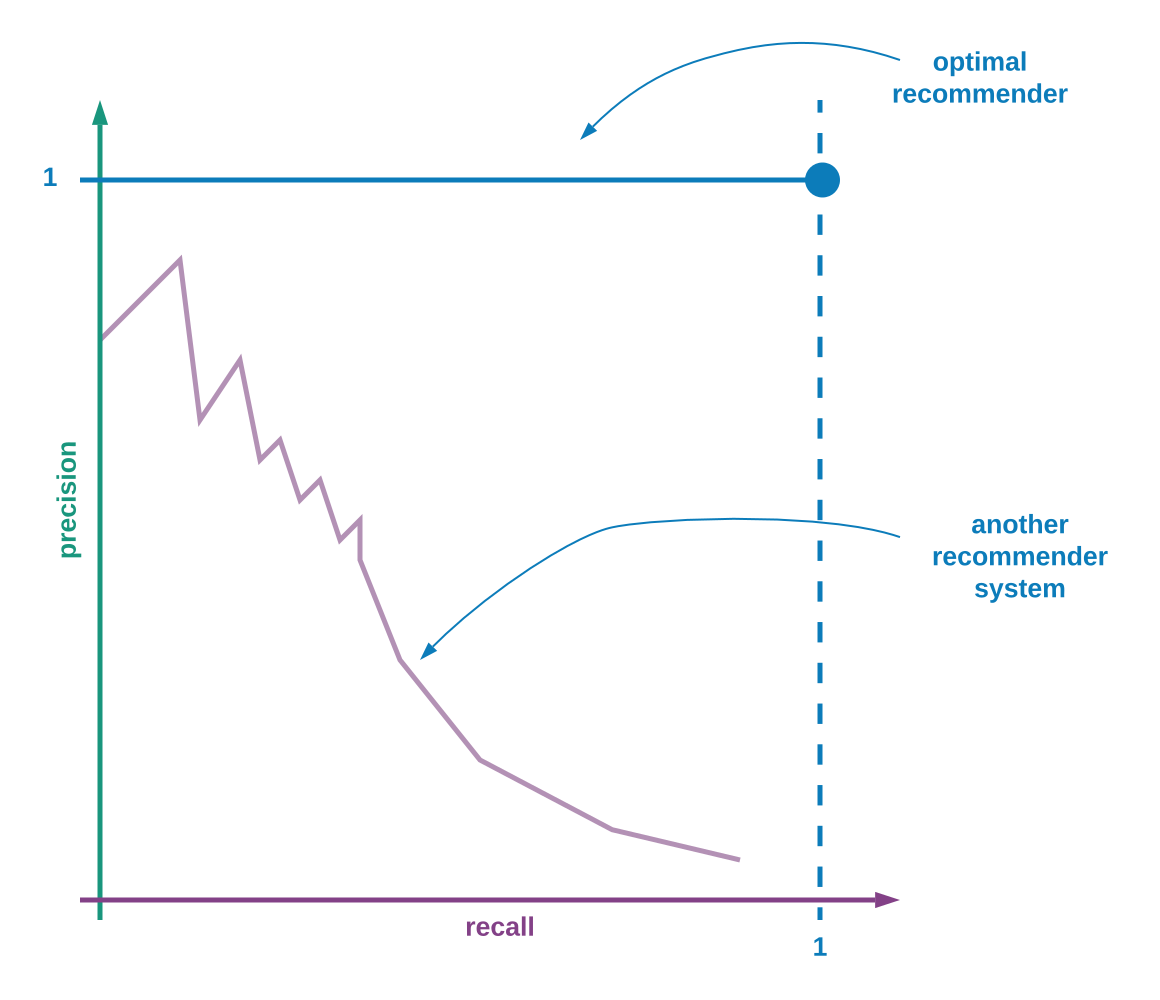
Talk about how to use these metrics of precision and recall to compare the different algorithms that might think about using. To do this, can draw something that’s called the precision recall curve.
what these curves are going to represent?
- For a given recommender system
- Vary the threshold on how many items that recommender system is allowed to recommend
- Going to rank, for example all the baby products on Amazon
- Allow to recommend just one, or two, or three, and so on
- That’s going to trace out the curve
What would this curve look like for optimal recommender where only recommend products that is liked?
- What’s the precision when recommend just one product?
- It’s known to be a product that’s liked
- The world is just that one product, and is liked
- The precision is
- What’s the recall though
- For example, if items liked, and only uncovered , it is
- Likewise, if increasing the number of items shown, the precision always stays at , it is only recommending products liked
- But the recall is increasing because it is covering more and more items liked
- So eventually, it will hit the spot
- So the optimal precision-recall curve is the horizontal line at
But need to talk about what the curve might look like for another more realistic recommender.
- The first product to recommend might not be a product that is liked, or it might be
- It’s going to start somewhere on a precision axis
- Then eventually at some point when it vary the threshold enough, at some point hopefully, it will recommend some product liked
- So both precision and recall are going to go up
- Then what tends to happen is it add a product that is not liked
- So at that point, the recall stays exactly the same because it haven’t recovered any more of the items that is of interest
- But the precision drops because now it is looking at a larger world, a larger set
- So precision goes straight down but the recall stays the same
- Tend to get these very jaggy looking curves or these drops in precision, then these increase in precision and recall
- This is an example of a more realistic system
Which Algorithm The Best?
- For a given precision, want recall as large as possible (or vice versa)
- One metric: largest area under the curve (AUC)
- Another: set desired recall and maximize precision (precision at k)
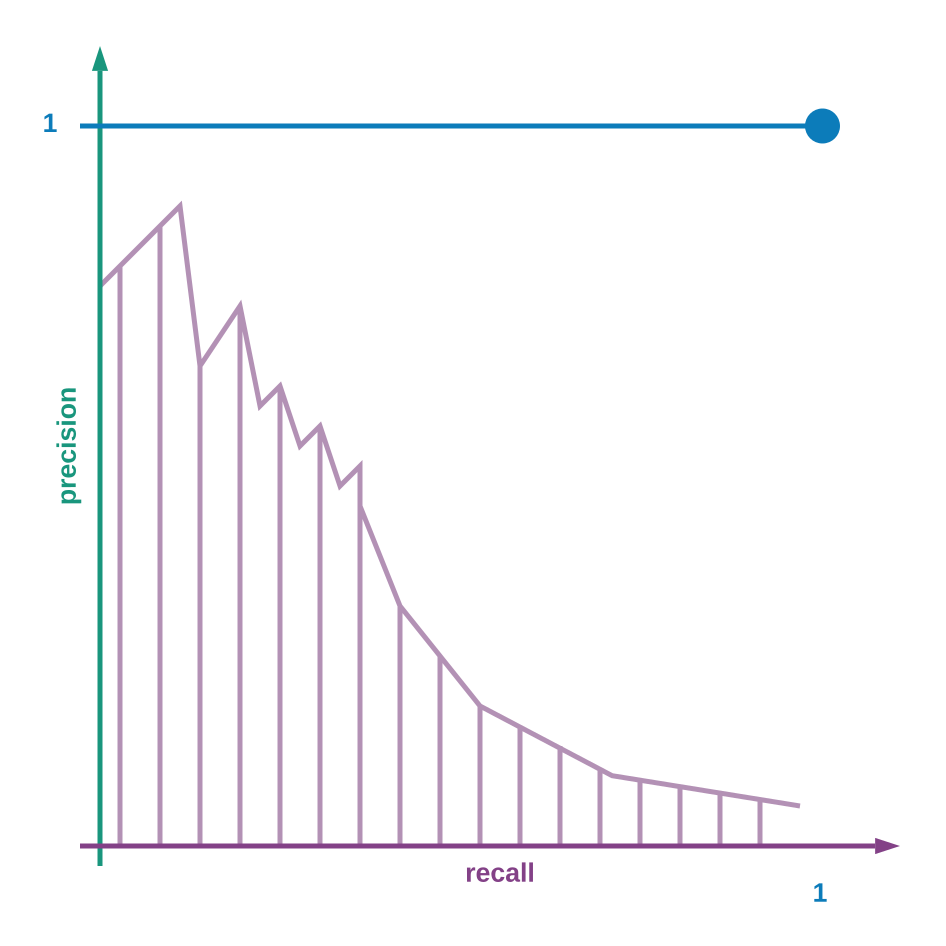
So it is now known how to draw these precision-recall curves, can talk about comparing different algorithm, how to know which one is best?
Well, it is known that the precision and recall both should be as large as possible, and what’s the best that it can be? It is talked about as the optimal recommender being that curve.
But then when look at the other curves, which are the jaggy looking curve (the other, realistic recommender system), one doesn’t have to strictly dominate another. They might do different things at different points (different curves). It’s not that one is always going to be better than the other.
So in this case, how to think about comparing these different algorithms, and choosing which one is best?
- Want precision and recall to be as large as possible
- But one thing can be measure to compare these in general is which one is doing better than the other (what’s a way to think about that?)
- Can think about the area under the curve
- Can compare the area of one curve to the area under a different curve, and see which area is larger
- That is one proxy for which recommender system is doing a better job
- A metric can be used is something called area under the curve (AUC)
But might not care about how the recommender system is doing across all possible performance situations. Instead, might be in a situation where:
- Have a website, and know based on the real estate of that page, how many items can display
- So maybe can display different items to recommend to the user
- Know what the attention span of the users are in general
- Want to limit how many products recommend to products or something like this
- So in those cases, where it is specifically know how many products going to be recommending
- Care about what the precision is at that number of products recommended
- Because want that precision to be as large as possible for the constraint of recommending that number of products
So these are two examples of metrics might use to compare between different algorithm using this notion of precision and recall.
Summary For Recommender Systems
Talked about a notion of collaborative filtering and a couple different recommender systems for implementing that idea where, leveraging the types of other products people purchased to recommend other products. Explored this notion of having some set of customers and products and understanding relationship between these in the context of…
- Product recommendation tasks
- Thinking about movie recommendation
- In the IPython notebook explored this very concretely with an implementation of a song recommender
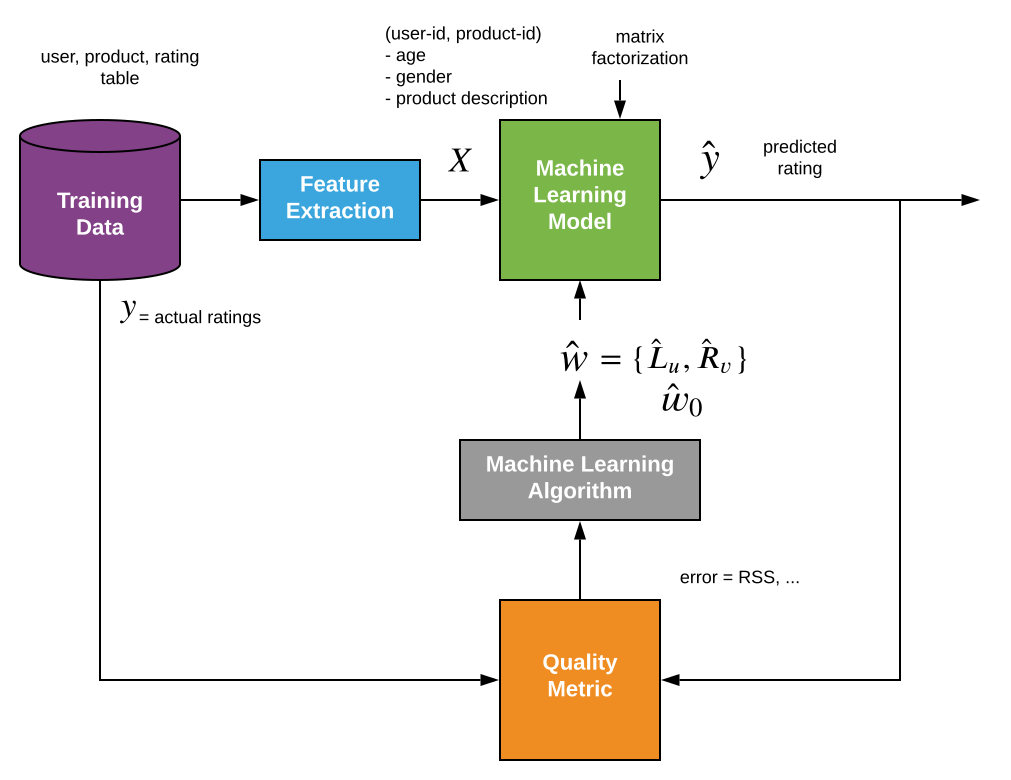
Once again, revisit this machine learning workflow, but in the context of recommender systems.
- What’s the training data
- Well it’s the user, product, rating table
- Going to extract some set of features, which in this case are a user ID, product ID pair
- The goal here is to predict the rating that some user would give to some product
- So user ID, product ID, rating
- So this is the predicted rating ()
- The model talked about quite extensively is matrix factorization
- Has some set of parameters ()
- Which are estimated parameters, or that notion represents estimated parameters
- What are the parameters of matrix factorization
- It’s a set of features for every user, and it’s a set of features for every product
- So these are the parameters, but also talked about a featurized version of matrix factorization
- So in that case, in addition to the features being the user ID and product ID
- Might also consider other things
- Might have a list of other features like…
- The age of the user
- The gender of the user
- A description of the product
- So on…
- In that case, would also add weights on these features, , that are also parameters of this model
- The idea is going to take the predicted rating, and going to see how well the model is fitting the data
- The way going to do that is going to take the actual data, the real ratings
- Going to compare to the predicted ratings
- So one metric talked about to measure the error between the predicted ratings and the actual observed ratings was residual sum of squares, just like in regression
- But there are also other metrics
- The point is that from some notion of error between the predicted values and the observed values, going to have some machine learning algorithm
- What it’s going to do is it’s going to iteratively update the features for the user and for the product until it get good agreement between the predicted rating and the actual observed ratings
What You Can Do Now…
- Describe the goal of a recommender system
- Provide examples of applications where recommender systems are useful
- Implement a co-occurrence based recommender system
- Describe the input (observations, number of “topics”) and output (“topic” vectors, predicted values) of a matrix factorization model
- Exploit estimated “topic” vectors (algorithms to come…) to make recommendations
- Describe the cold-start problem and ways to handle it (e.g., incorporating features)
- Analyze performance of various recommender systems in terms of precision and recall
- Use AUC or prevision-at-k to select amongst candidate algorithms
So learned how to do collaborative filtering in practice, so now can go out actually implement a recommender system. Can do a gift recommender for your family, which will make holiday shopping really easy, or can build a new song recommender. So lots and lots of cool things can do with collaborative filtering.
Reference
- Recommending Products
- Where To See Recommender Systems
- Building a Recommender System
- Solution 0: Popularity
- Solution 1: Classification Model
- Solution 2: People Who Bought This Also Bought…
- Solution 3: Discovering Hidden Structure By Matrix Factorization
- Bringing It All Together: Featurized Matrix Factorization
- A Performance Metric For Recommender Systems
- Summary For Recommender Systems
- Reference