Machine Learning Foundations A Case Study Approach Week 4
Clustering and Similarity: Retrieving Documents
Often there are a lot of observations, and want to infer some kind of structure underlying these observations. The structure gonna talk about is groups of related observations or clusters. In this case, it is about a task of retrieving documents of interest.
Retrieving Documents With Interest
Start with describing the task in a little bit more detail.
Document Retrieval
- Currently reading article
The article is about soccer, and like to retrieve another article that might be of interest in reading. But the question is how to do this? There are lots and lots of articles out there and can’t expect to go and reach each of them. Like to think of a way to automatically retrieve a document that might be of interest.
Challenges
- How to measure similarity?
- Need to have that in order to say that this article is similar to the one reading now
- Might also be of interest
- Large set of article that are very different and probably are not of interest
- How to search over articles?
- Retrieve the next article to recommend
Word Count Representation For Measuring Similarity
The first thing need to describe is how to represent documents being looked at.
Word Count Document Representation
- Bag of words model
- Ignore order of words
- Count # of instances of each word in vocabulary
Perhaps the most popular model to represent a document is something called the bag of words model. Simply ignore the order or words that are present in the document.
The reason it’s called a bag of words model is
- Think of taking a bag
- Throwing all the words from that document into the bag
- Shaking it up
- The new document created with the words all jumbled up has exactly the same representation as the original document where the words were ordered
Instead of considering the structure or order of the words, simply gonna count the number of instances of every word in the document.
So in this document, there’s just one sentence:
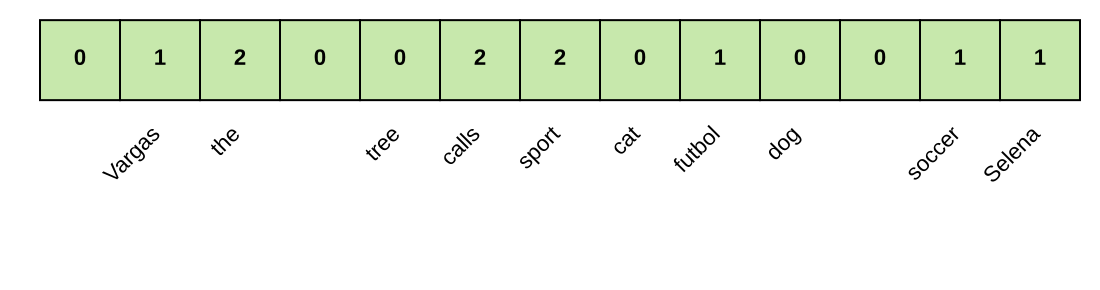
Vargas calls the sport futbol, Selena calls the sport soccer.
To count the number of instances of words in this very short document, gonna look at a vector. This vector is defined over the vocabulary.
- So maybe one word in the vocabulary is the name, Vargas (1 instance)
- Another place in this vector is the index for the word sport (2 instances)
- Somewhere else have the word futbol (1 instance)
- Then say Selena is the last entry (1 instance)
- There is also the word calls (2 instances)
- Of course the word the (2 instances)
- Also the word soccer (1 instance)
For this document, every other entry would be zero (0 instance). All these other entries represent all the other words that are out there in the vocabulary. These can be like the word cat, and dog, and tree, and every other word.
So it’s a very, very long and sparse vector that counts the number of words seen in this document.
Measuring Similarity
Talked about this representation of documents in terms of just these raw word counts, this bag of words model.
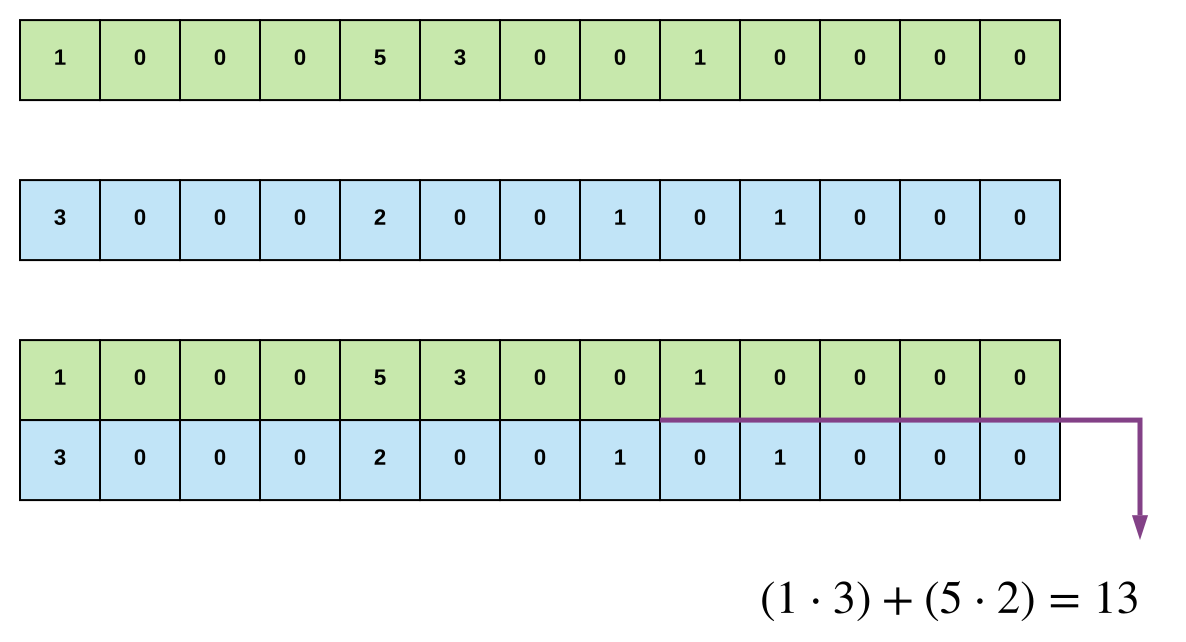
Want to talk about how to measure the similarity between different documents. Gonna use that in order to find documents that are related to one another and so on. Vargas is reading an article, so what’s another article of interest?
- So imagine that this is the count factor for this article on soccer, with this famous Argentinian player, Messi
- Then there’s another article showing in blue and the associated word counts, this article is about another famous soccer player, Pele
So when thinking about measuring similarity, simply look at an element wise product over this vector.
- So for every element in the vector, gonna multiply the two elements appearing in these two different count vector
- Add up over all the different elements in this vector
So that measures the similarity between these two articles on soccer.
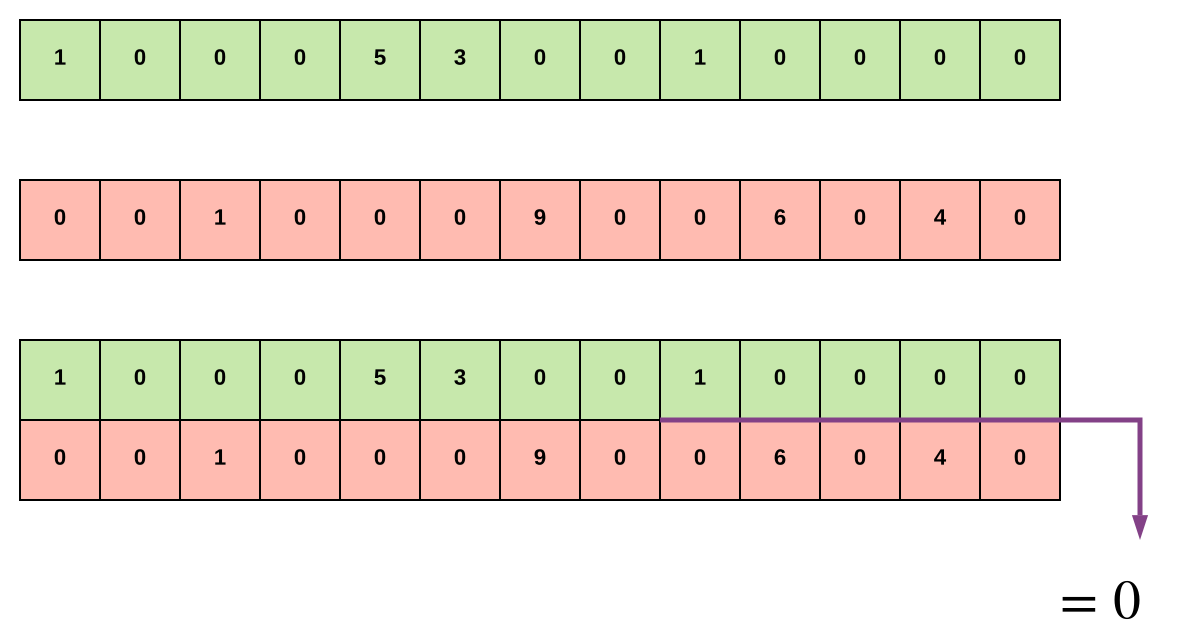
But now compare to another article, which happens to be something about a conflict in Africa.
- Providing the example of word counts that appear in this article
- When go to measure the similarities between these articles, using the method described of element wise product, and then adding
- That the similarity here in this case is 0
Issues With Word Counts - Document Length
Talk about an issue that arises when using these raw word counts to measure the similarity between documents.
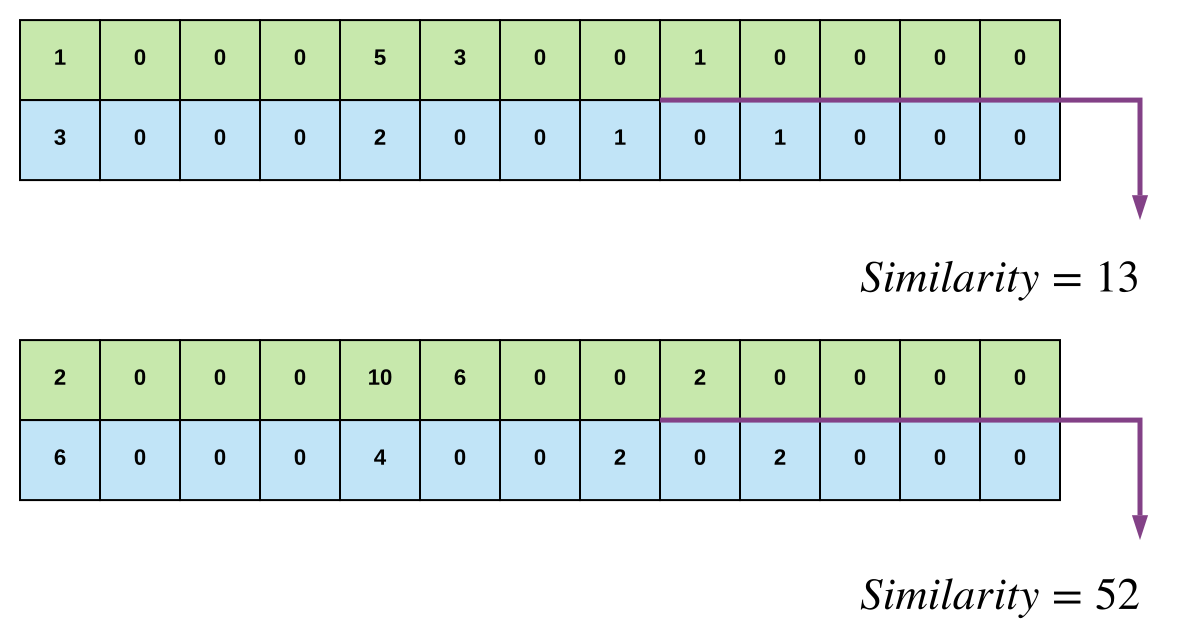
So to do this, look at these green and blue articles. Repeating the word count vectors, what is calculated before was the fact that the similarity between these two articles that are both about soccer is .
But now look at what happens if simply double the length of the documents.
- So now every word that appeared in that original document appears twice in this twice as long document
- So the word count vector is simply two times the word count vector had before
- So when go to calculate the similarity here, now the similarity is calculated to be .
Think about this.
- What it is saying is that two documents that are related to each other in the same way as before
- They’re both talking about the same two sports
- But one just is replicated twice is a lot more similar
It could be said, that someone is a lot more interested in this longer document. Then what happened when reading the shorter documents? So this doesn’t make a lot of sense when trying to do document retrieval. It biases very strongly towards long documents. So think about how to cope with this.
Solution - Normalize
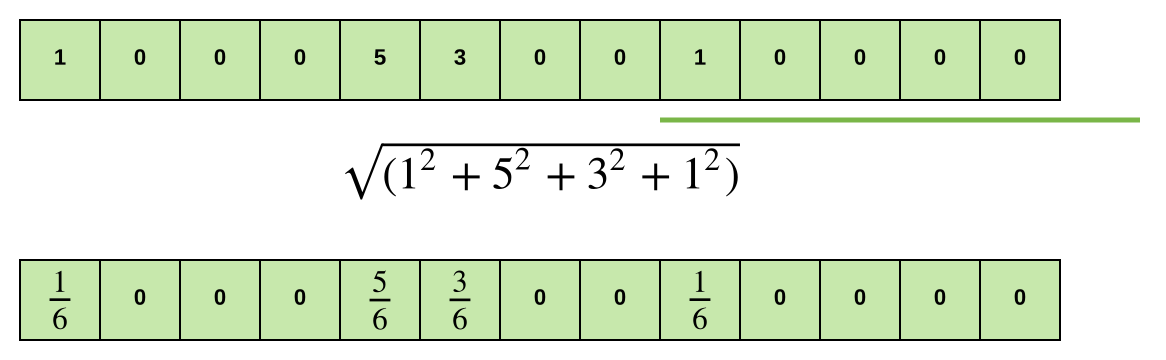
So one solution is very straightforward where simply gonna normalize this vector.
- Take this word count vector and gonna compute the norm of the vector
- Computing the norm of a vector, simply add the square of every entry in the vector
- Then take the square root
So in this case, that happens to be the number . The resulting normalized word count vector is shown on the bottom. What this does is it allow to place all articles considering, regardless of length, on equal footing. Then use this normalized vector when doing retrieval.
Prioritizing Important Words With TF–IDF
So the normalized count vector just described helped address some of the issues with the original proposal of just using raw word count as the representation of the document. But there’s another issue, which is often, like to really emphasize the important words in a document. So gonna discuss a little bit about what it means to be an important word and how to think about emphasizing them.
Issue With Word Counts - Rare Words
Common words in document:
- the
- player
- field
- goal
Dominate rare words like:
- futbol
- Messi
Before talking about important words, first talk about rare words. Imagine reading an article about soccer, and in this article there are lots and lots of common words. What it means by a common word, it’s a word that appears frequently in the corpus. In the corpus, that’s just terminology for all the documents out there when doing the task of retrieval.
What happens though is that these common words dominate the similarity metric talked about when compare against other documents. These words appear in lots and lots of documents. Whereas in contrast, there are some very rare words in this document being looked at. Words like futbol, Messi, the specific player, that get completely swamped by all these common words. They get swamped because they just appear very infrequently in the corpus.
So think about how to increase the importance of these rare words. Those often are the ones that are really relevant in describing what’s unique about the article, and what might indicate which other article out there is interested in reading.
Document Frequency
- What characterizes a rare word?
- Appears infrequently in the corpus
- Want to up weight these rare words
- Appears infrequently in the corpus
- Emphasize words appearing in few docs
- Equivalently, discount word based on # of docs containing in corpus
- Think about taking each word
- Discounting the weight on that word based on how many document that word appears in the entire corpus
- Equivalently, discount word based on # of docs containing in corpus
Important Words
- Do we want only rare words to dominate??
- Clearly don’t wanna emphasize the very common words
- The words like the, a, it, etc.
- Wanna include things that are very relevant for that document
- So not just words like Messi, but also probably soccer, field, and goal
Things that describe the sport looking at, which might be different tha ever another article about sport. An article about basketball that takes about basketball, hoop, court, and words like that. So in this case, wanna emphasize what is call important word.
- What characterizes an important word?
- Appears frequently in document (common locally)
- Appears rarely in corpus (rare globally)
- Trade off between local frequently and global rarity
TF-IDF Document Representation
- Term Frequency - Inverse Document Frequency (tf-idf)
One way to represent this trade off between something that’s common locally but rare globally is something that’s called TF–IDF.
So first describe what term frequency is.
- Gonna look locally
- Looking just at the document that the person is currently reading
- Simply count the number of words
-
So this is just the word count factor
- Term Frequency
- Same as word counts
- But then, gonna down weight this factor based on something called the Inverse Document Frequency
For this, gonna look at all documents in the corpus, and gonna compute the following.
- Inverse Document Frequency
- # docs is the number of document in the corpus
- # docs using word is the number of document that contain the word looking for
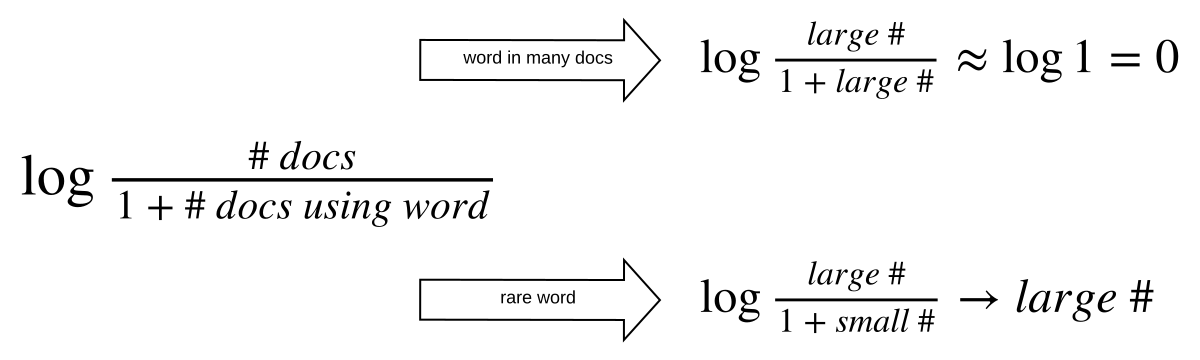
So think about why have this form?
- So first, think about a very common word (a word appearing in many documents)
- So here, gonna be very, very strongly down weighting all the way to zero
- The counts of any word that appears extremely frequently
- Where that appears in all of the documents
- But in contrast, if have a rare word
- A large number, assuming have a large number of documents
- This is gonna be, or to say some largeish number, or a not a zero, or a small number
- The reason to have this here, is the fact that can’t assume every word appears in any documents in the corpus
- So there might be some word in the vocabulary that doesn’t appear anywhere in the corpus
- Also wanna avoid dividing by 0
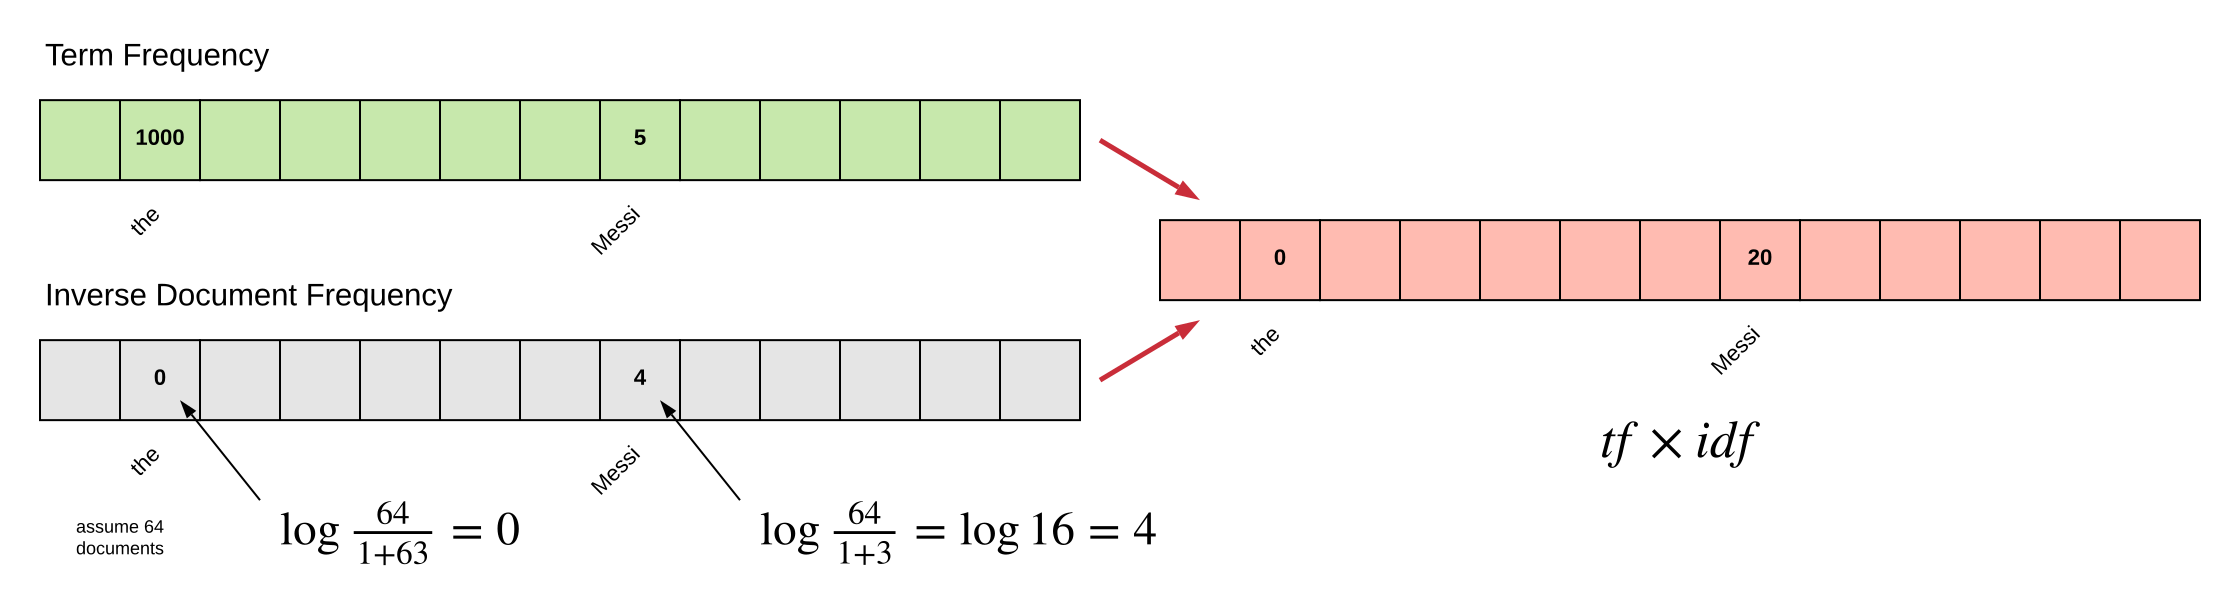
So looking at an example
- Where there’s the index for the word the.
- Say that appears something like times in the document looking at
- Then there’s the word Messi
- Appears times
- Now gonna look at computing the inverse document frequency for that word
- So the word the
- Assume that the word the appears in every document in the corpus, except one
- So when looking at this entry, gonna compute of the number of documents in the corpus
- Assume there are documents in this corpus
- Assume that the word the didn’t appear in one of these documents
- So what his gives is the that talked about before
- So the word the gets down weighted completed by
- In contrast, when looking at Messi
- Assume to have some total documents
- Assume that the word Messi appears only in of these documents
- So this is the term frequency, and the inverse document frequency of these two words
When go to compute the term frequency, inverse document frequency, for specific document which is gonna be the new representation of this document, simply multiple these two factors together.
- So theres some numbers here, where the word the, turns into a
- Then there are some other number and then the word Messi is gonna be up weighted, so a weight of .
The point wanna make here is the fact that these very common words like the, get down weighted and the rare and potentially very important words like Messi are getting up weighted.
Retrieving Similar Documents
So talked about how to represent documents and also talked about how to measure similarity between documents. So now turn to the actual task of interest which is retrieving a document. So someone is reading an article, assuming they like that article, and like to present them with another article to read.
Nearest Neighbor Search
So in particular one of the most popular ways of doing this is something called nearest neighbor search.
- Query article
- Article being read
- Corpus
- All of the documents out there to search over to recommend some new article
- Specify: Distance metric
- So this is gonna be the measure of similarity that talked about earlier
- Output: Set of most similar articles
- Then what algorithm is gonna output is a collection of related articles
1-Nearest Neighbor
So one example of nearest neighbor search is something called 1-Nearest Neighbor.
- Input: Query article
- Output: Most similar article
- What gonna return is just simply the most related article, out of all those articles out there, to the query article
- Algorithm:
- Search over each article in corpus
- Compute
- Gonna compute the similarity using the methods described earlier between the query article and this article examining in the corpus
- If and set
- If that similarity is better than the best similarity that is found so far, then gonna keep this article as the best article that is found so far
- Search over each article in corpus
- Return best article
- Then at the end after iterated through every article in the corpus
- Gonna look at what is the best article found
- Gonna recommend this to the reader
K-Nearest Neighbor
A very straightforward variant of this is something called K-Nearest Neighbor search. Instead of just outputting the most relevant article found, gonna present the reader with a collection of different article that are the top most relevant articles.
- Input: Query article
- Output: List of K similar article
The algorithm is nearly identical except instead of keeping just the most related article, gonna keep a priority queue of the top article found so far.
Clustering Documents
So that’s one way to retrieve a document of interest
- Just take all articles out there
- Scan over them
- Find the one that’s most similar according to the metric that is defined
But another thing might be interested in doing is clustering documents that are related.
- Might have a whole bunch of articles about sports, or world news, or different things
- Can structure the corpus in this way
- If a person is reading an article that is about sports
- Then it can very quickly search over all the other article about sports
- Instead of looking at every article that’s out there in the entire corpus
But the challenge here is the fact that these articles aren’t going to have labels. Like to discover these underlying groups of articles.
Structure Documents By Topic
The goal is to discover these groups or clusters of related articles. As mentioned before, one might represent a set of articles like sports, and another one a set of article world news.
- Discover groups (clusters) of related articles
- Sports
- World News
Some Labels Are Unknown?
For the time being, actually assume that someone provided with the labels.
- Somebody goes through and reads every article or at least a large subset of articles in the corpus
- Labels them and say these articles are all about sports, about world news, about entertainment, and about science
-
Have some set of articles that have labels associated with them
- Training set of labeled docs
- Sports
- World News
- Entertainment
- Science
Multiclass Classification Problem
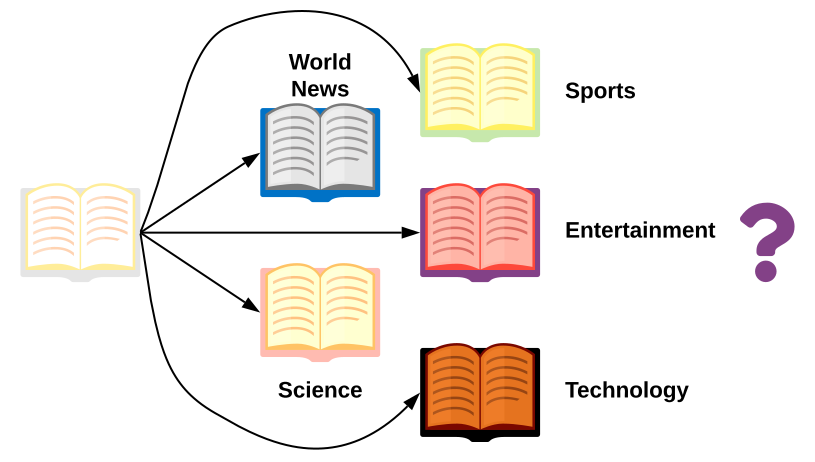
In this case, have a query article and like to assign it to a cluster, this ends up being just a multiclass classification problem.
- Here is the query article
- Do not know the label associated with it
- Have a bunch of label document
- World news
- Science
- Sports
- Entertainment
- Technology
- Want to classify which class this article belongs to
It’s just a multiclass classification problem. So if that were the case, that would be an example of a supervise learning problem.
Clustering
Assumption:
- No ables provided
-
Want to uncover cluster structure
- Input: docs as vectors
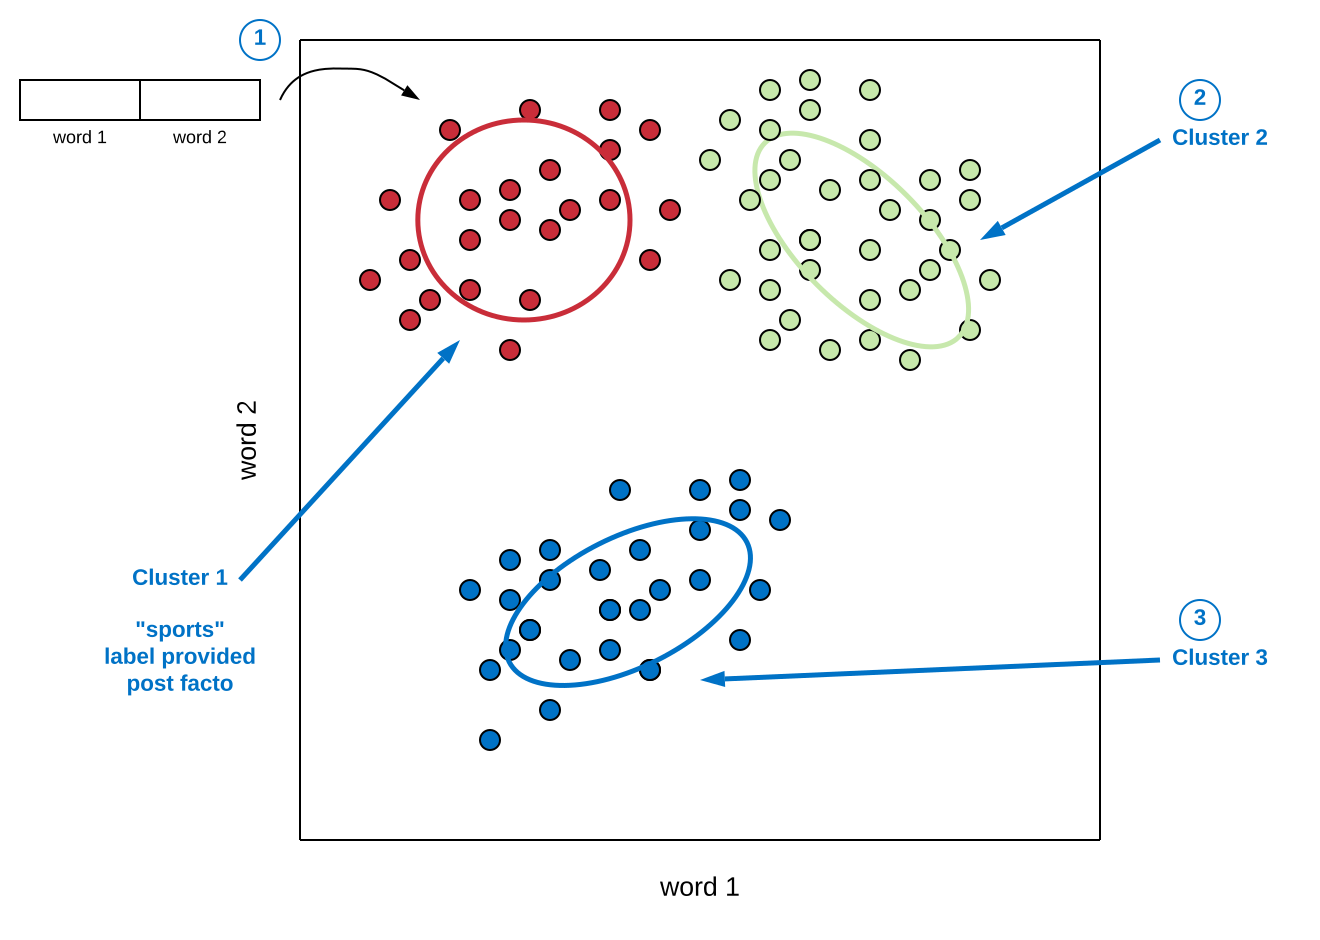
- Every observation plotting here is the word count vector
- Output: cluster labels
In this case, looking at a very simple example with a vocabulary that only has two words.
- Input: to a clustering algorithm
- Have a vector, have word 1 and word 2
- X-Axis: word 1
- Y-Axis: word 2
- Have a vector, have word 1 and word 2
Of course, remember that in reality there tend to be very large vocabularies and have big high dimensional vectors. So when plotting observations, they are really in this high dimensional space, but for visualization, just look at this 2D representation. Have a whole bunch of documents here, all represented by their word counts over these two different words in the vocabulary.
- Output: gonna bu cluster labels
- Observation get labeled
- Red (Cluster 1)
- Green (Cluster 2)
- Blue (Cluster 3)
- Post facto
- Go through and look at some articles in cluster
- Say that this cluster is really a cluster about “sports”
- Write down explicitly that this label is provided post facto
- Observation get labeled
This is an example of an unsupervised learning task because it operating without any labels. Have observations and trying to uncover some structure in these observations.
So again, just to reiterate, the input are the word count vectors and the output is for every document in the corpus, associate some cluster label with that document.
What Defines Cluster?
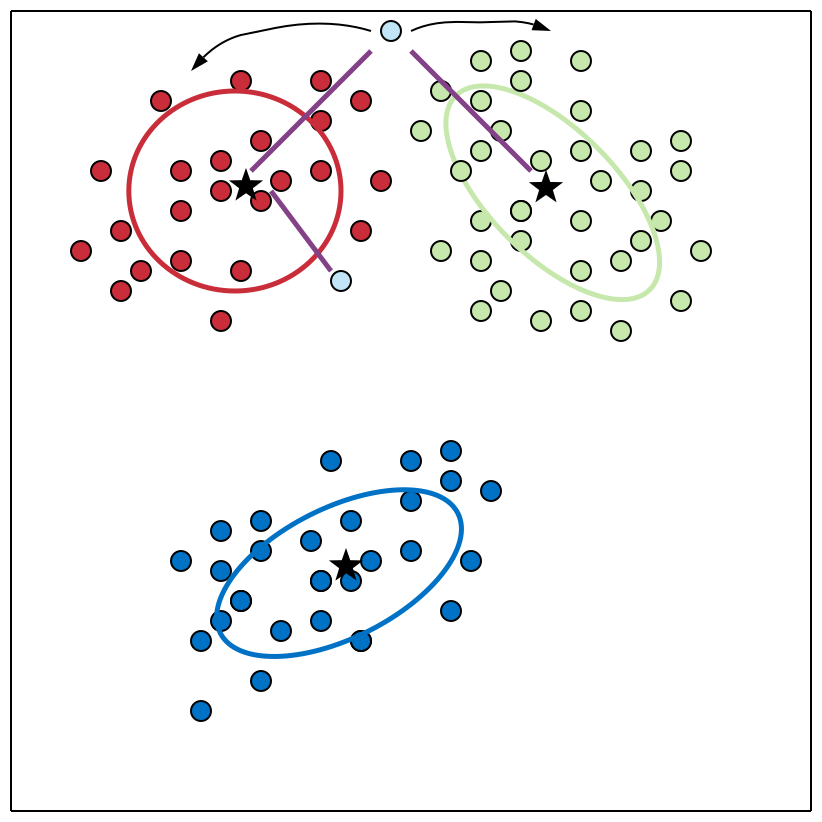
- Cluster defined by center & shape/spread
- Center: mark cluster centers with star
- Shape: ellipses are representing the shapes of each of the cluster
- Assign observation (doc) to cluster (topic label)
- Score under cluster is higher than others
- Often, just more similar to assigned cluster center than other cluster center
When thinking about whether an observation should be assigned to the green cluster, or the red cluster. Look at how similar the article is to other articles based on the shape of the cluster.
Score every observation based on the cluster center as well as the shape of that cluster. In this case, because the cluster has oblong skewed shape, it actually gets assigned to the green cluster instead of the red cluster.
But another approach which is very common is instead of looking at the shape of the cluster, just look at the cluster center. So just measure the distance of the observation to the green cluster center versus the red cluster center. In this case, it would be very challenging to decide whether that article should go with the green cluster or the red cluster.
But, there are other cases with observation where pretty obvious with metric it would get assigned to the red cluster.
K-Means
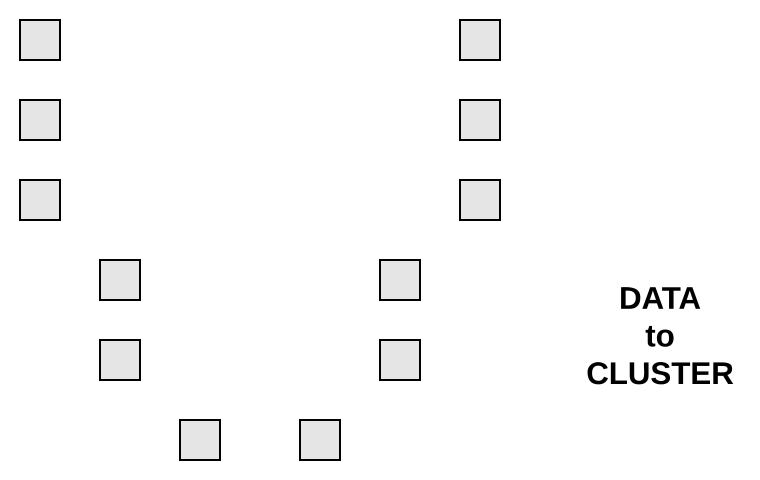
Looking at an algorithm for doing clustering that uses the metric of the distance to the cluster center. Here is the data wanted to cluster.
- Assume
- Similarity metric = distance to cluster center (smaller better)
K-Means Algorithm
The algorithm is called the k-means algorithm
- Starts by assuming that it will end up with clusters
- So specify the number of clusters ahead of time
- So the reason the algorithm is called k-means is it have clusters
- Looking at the means of the clusters
- Just the cluster center
- When assigning points points to the different cluster
Step 0
Initialize cluster centers
- There are many ways to initialize where to put the cluster centers
- But for now, assume it is randomly assigned three different cluster centers
- If assume some three means algorithm
Step 1
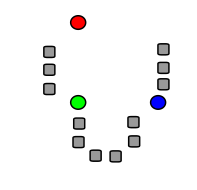
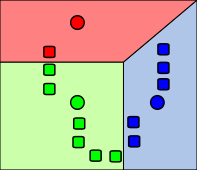
Assign observations to closest cluster center
- Observation gets assigned to the red cluster
- Observation gets assigned to the green cluster
- Observation gets assigned to the blue cluster
A way to do this is something that’s called a Voronoi Tessellation.
- Look at the cluster center
- Define the regions
- Color regions represent areas where any new observation falls
- If it is within the red region, it is closest to the red cluster center
- If it is within the green to green, blue to blue
Step 2
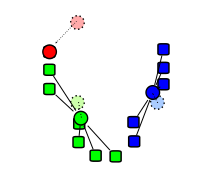
Revise cluster centers as mean of assigned observation
End up with are observations that are assigned to clusters. But those cluster centers are randomly initialized, so probably don’t believe it really represents the structure of the underlying data. Need to iterate this process, update what the definition is of the cluster center based on the observations that is assigned.
In the red cluster, it just had one observation assigned to it. So when go to revise the cluster center for that cluster, it just moves to the previous observation.
But for the green cluster, if look at the previous cluster center, it is going to move it to the center of mass of all the observations that have been assigned to the green cluster.
Likewise for all of the blue observations.
Step 3
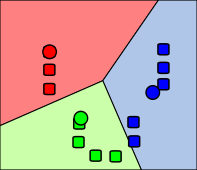
Repeat 1 + 2 until convergence
So now with a new set of cluster centers, redraw this Voronoi Tessellation, and reassign the observations to the nearest cluster center. Then iterate this process until convergence.
Other Examples
Talked quite exhaustively about this notion of clustering for the sake of doing document retrieval. But there are lots and lots of other examples where clustering is useful.
Clustering Images
- For search, group as:
- Ocean
- Pink flower
- Dog
- Sunset
- Cloud
- …
One application is for image search. It would be really helpful to structure all the images by some set of categories like ocean, pink flower, dog, sunset, clouds, etc. So clustering is very helpful for doing structured search.
Grouping Patients By Medical Condition
- Better characterize subpopulations and diseases
Another very different application is group patients by their medical condition. So here a goal might be to better characterize subpopulations as well as different diseases.
Example: Patients With Seizures Diversity
Look at a whole bunch of patients that have seizures.
- Three brains represent three different patients
- Different recording setups that are measuring the seizure activity
- For each of these patients, get a collection of recordings of different seizures that they exhibit over time
Between these different patients there might be similar types of seizures that appear in these different patients.
Cluster Seizures By Observed Time Courses
- Take all of these seizure recordings from three different patients and thing about clustering them
- Identify different types of seizures in this way
- Can allow better treat the types of patient by observing based on understanding what types seizure they exhibit
Products From Amazon
- Discover product categories from purchase histories
Well another application is thinking about doing product recommendation on Amazon.
- So for example, on Amazon there are a lot of third parties that come and they post some product to be sold.
- They provide a label of what that product is
- Maybe a person wants to sell a crib and they label the crib (fairly reasonable, as being a furniture item)
- So maybe get posted under the furniture category
- But if instead, look at who purchases this item
- Look at their purchase history
- Look at other people with similar purchase histories
- So maybe the person who purchased this item also purchased baby car seat
- Well then maybe infer that a better label for this crib
- Which had been labeled furniture is really to have labeled it as a baby product
So in addition to discovering groups of products that are related. Based on purchase histories of these items, use that to discover groups of related users on Amazon, and that can be used for targeting products to those users.
Structuring Web Search Results
- Search terms can have multiple meanings
- Example: cardinal
- Use clustering to structure output
Can structure out articles based on their content. Can improve search results to people.
Discovering Similar Neighborhoods
- Task 1: Estimate price at a small regional level
- Challenge:
- Only a few (or no!) sales in each region per month
- Solution:
- Cluster regions with similar trends and share information within a cluster
Another one that’s quite interesting is thinking about collections of neighborhoods and there are a few applications to discover similar neighborhoods.
One is to estimate the price of a house a a very small local regional level.
- So in this case, it challenges the fact that it only have a few, or very often, no house sales observations within a very small neighborhood
- So if to estimate the value of the house in that neighborhood at a point in time
- It’s very hard to do that because it have no other houses to base the estimate off of in that neighborhood
- However, if can discover other neighborhoods that have similar type of house price dynamics
- Then can come up with a good estimate of the house in the neighborhood with few or no sales by leveraging information from other neighborhood that was discovered to be related to the current neighborhood
- So the idea is to discover clusters of neighborhoods
- Then within those clusters can share information like these house sales information to form better estimates
So the solution describing here is to cluster regions with similar trends, and then share information within a cluster.
- Task 2: Forecast violent crimes to better task police
- Again, cluster regions and share information!
- Leads to improved predictions compared to examining each region independently
The same idea of discovering related regions can be used for helping to forecast violent crimes, to better task police forces to different regions.
- So again once discover different neighborhoods that have very similar crime dynamics
- Can form better predictions of the rates of violent crimes in those neighborhoods
- Then use that information to task police to those regions
Summary For Clustering Similarity
- Talked about a document retrieval task
- Talked about a notion of clustering where trying to uncover some underlying structure in the data
- Talked about many different areas in which this notion of clustering can be really useful
Workflow For Clustering Algorithm
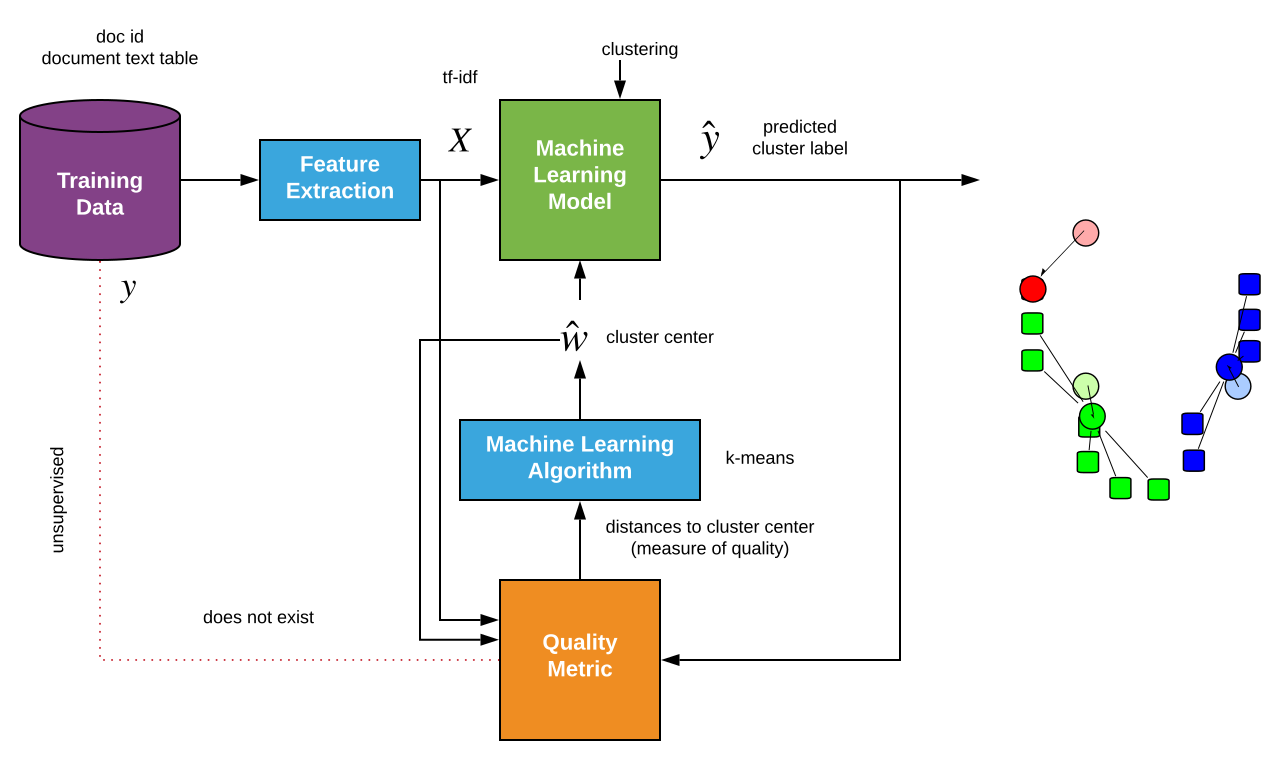
This one is going to be a bit different.
- Training data
- Here the training data for a document clustering task is going to be a document ID and document text table
- Have a whole bunch of documents
- Have all the texts associated with each of those
- Feature extraction
- Extract some set of features
- Many different ways to represent a document
- One example is tf-idf representation
- Try to cluster documents based on this representation
- Machine learning model
- Put these features through some machine learning model
- Which in this case is a clustering model
- Output for each document a cluster label
- So the output () is the preducted or estimated cluster label
- Want to access the accuracy of the cluster label
- But don’t have true cluster labels to compare against
- Unsupervised learning setting
- The here does not exist
- Because it is an unsupervised learning setting
- Quality Metric
- Somehow want to access some measure of accuracy of the clustering
- The measure of accuracy, the way to measure the quality is to look at how coherent the clustering is
- Look at the distances from each observation to their assigned cluster center
- Good clustering algorithm has those distances very small
- The goal is to minimize these distances
- To measure this accuracy, to measure these distances
- The data is needed, the tf-idf vectors
- Also the need the cluster center (), the current estimate, the model parameter for the k-means algorithm
- So instead of having actual cluster labels to assess accuracy
- Take the document representation and the cluster center
- Plug it into this quality measure
- Which is looking at distances to cluster center
- That’s the measure of quality
- Algorithm
- Talking about k-means as a method of doing clustering
- There are others
- Trying to minimize the distance, or sum of these distances
- Doing it iteratively
- It’s updating () had before
- Moving it to a new () that represents the center of mass of the points
For a high level
- Take the documents
- Represent them in some way
- Raw word counts
- TF-IDF
- Normalizations
- Different bigrams, trigrams
- The clustering algorithm producing clustering labels and iteratively
- Like k-means
- Looping through again and again to update the cluster center (the parameters of the clustering model)
- Look at how far the assigned observations are to those cluster centers
What You Can Do Now…
- Describe ways to represent a document (e.g., raw word counts, tf-idf, …)
- Measure the similarity between two documents
- Discuss issues related to using raw word counts
- Normalize counts to adjust for document length
- Emphasize important words using tf-idf
- Implement a nearest neighbor search for document retrieval
- Describe the input (unlabeled observations) and output (labels) of a clustering algorithm
- Determine whether a task is supervised or unsupervised
- Cluster documents using k-means (algorithm details to come…)
- Describe other applications of clustering
Presented some of the algorithmic details behind the methods
- Specifically clustering.
- Talked about the k-means algorithm
- For the document retrieval task, talked about doing nearest neighbor search, provided some of the algorithmic details
- Explore in doing Wikipedia entry retrieval